Fig. A.1.
Download original image
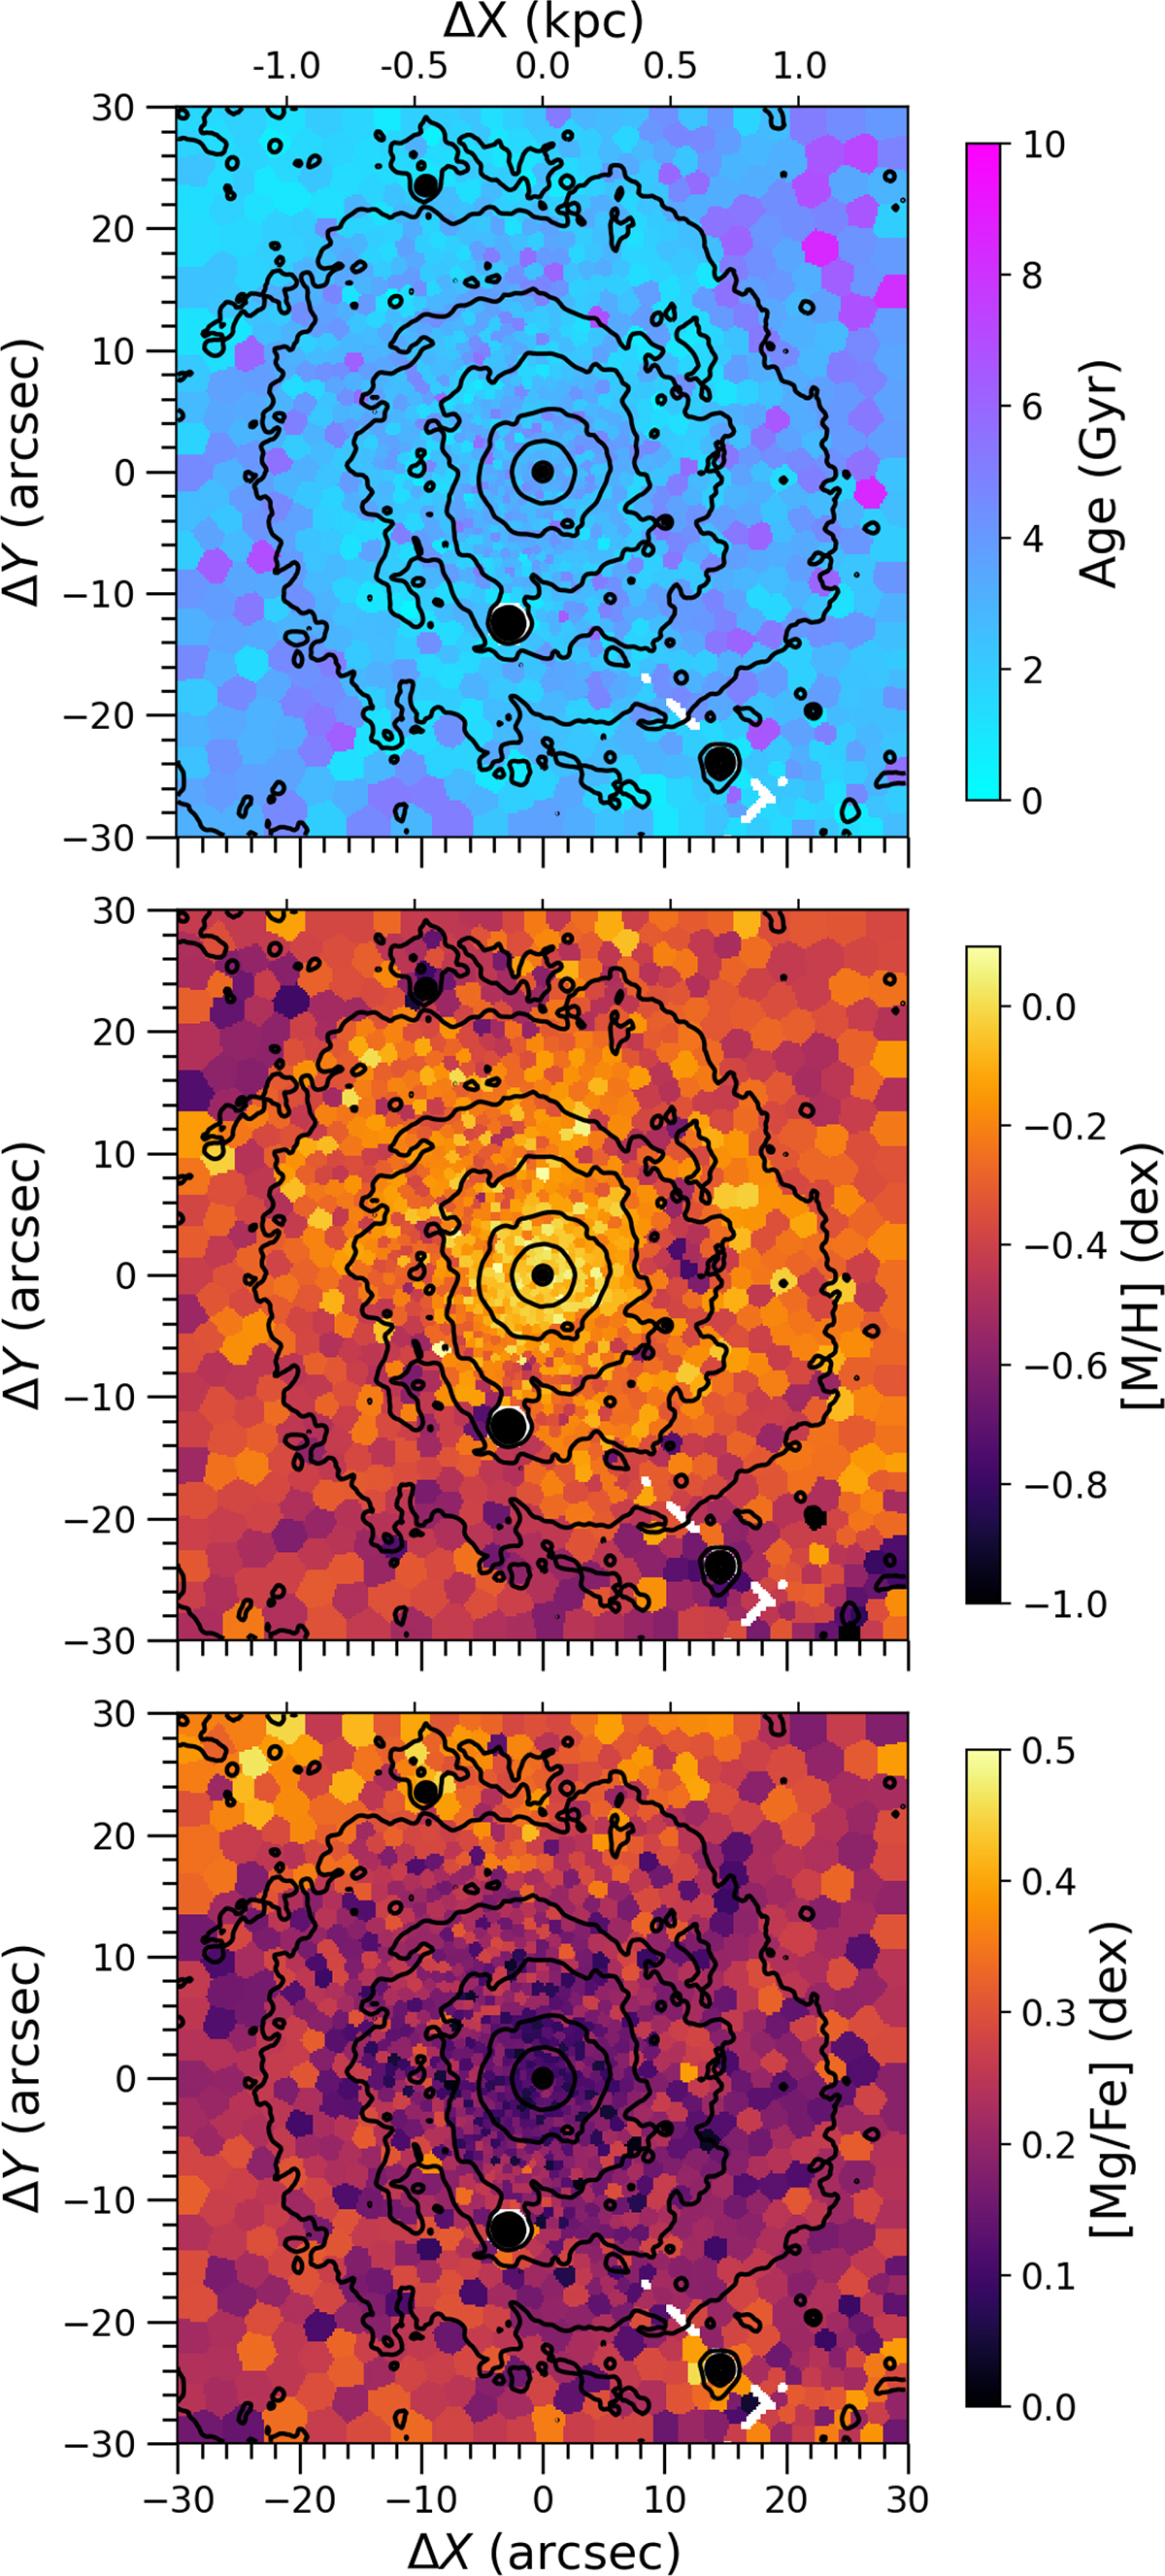
Stellar population maps of the central arc minute of M 74, extracted from the integrated (kinematic-corrected) data cube. From top to bottom: mean age, total metallicity [M/H] and [Mg/Fe] abundance. Masked regions are depicted in white and isophotal contours in black. The physical scale is given as a reference on the top X axis.
Current usage metrics show cumulative count of Article Views (full-text article views including HTML views, PDF and ePub downloads, according to the available data) and Abstracts Views on Vision4Press platform.
Data correspond to usage on the plateform after 2015. The current usage metrics is available 48-96 hours after online publication and is updated daily on week days.
Initial download of the metrics may take a while.