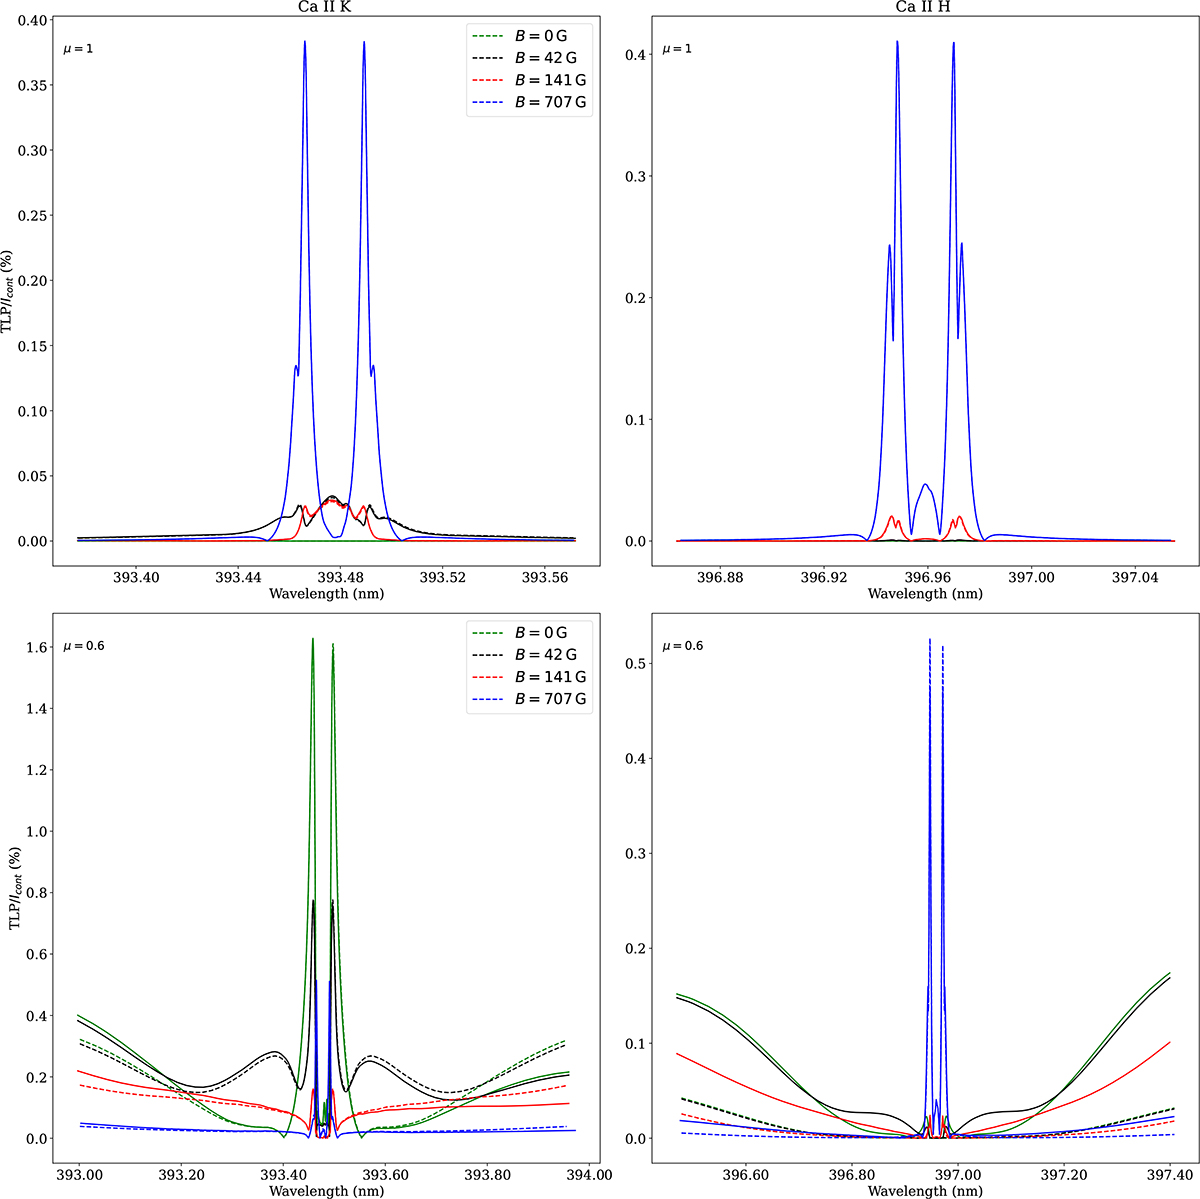
Fig. 3.
Download original image
Fractional linear polarisation of the Ca II H and K lines under the multilevel and multiterm formalisms. As in Fig. 2, continuous curves represent the results of the MT formalism, while the results of the MZ formalism are shown in dashed curves. The different colours represent different values of B, which is shown inside the panels. The top panels show the results viewed at disc centre (μ = 1), while the bottom panels show the results for μ = 0.6. The panels on the left show the results for the Ca II K line, while the panels on the right side show the results for the Ca II H line.
Current usage metrics show cumulative count of Article Views (full-text article views including HTML views, PDF and ePub downloads, according to the available data) and Abstracts Views on Vision4Press platform.
Data correspond to usage on the plateform after 2015. The current usage metrics is available 48-96 hours after online publication and is updated daily on week days.
Initial download of the metrics may take a while.