Fig. 5.
Download original image
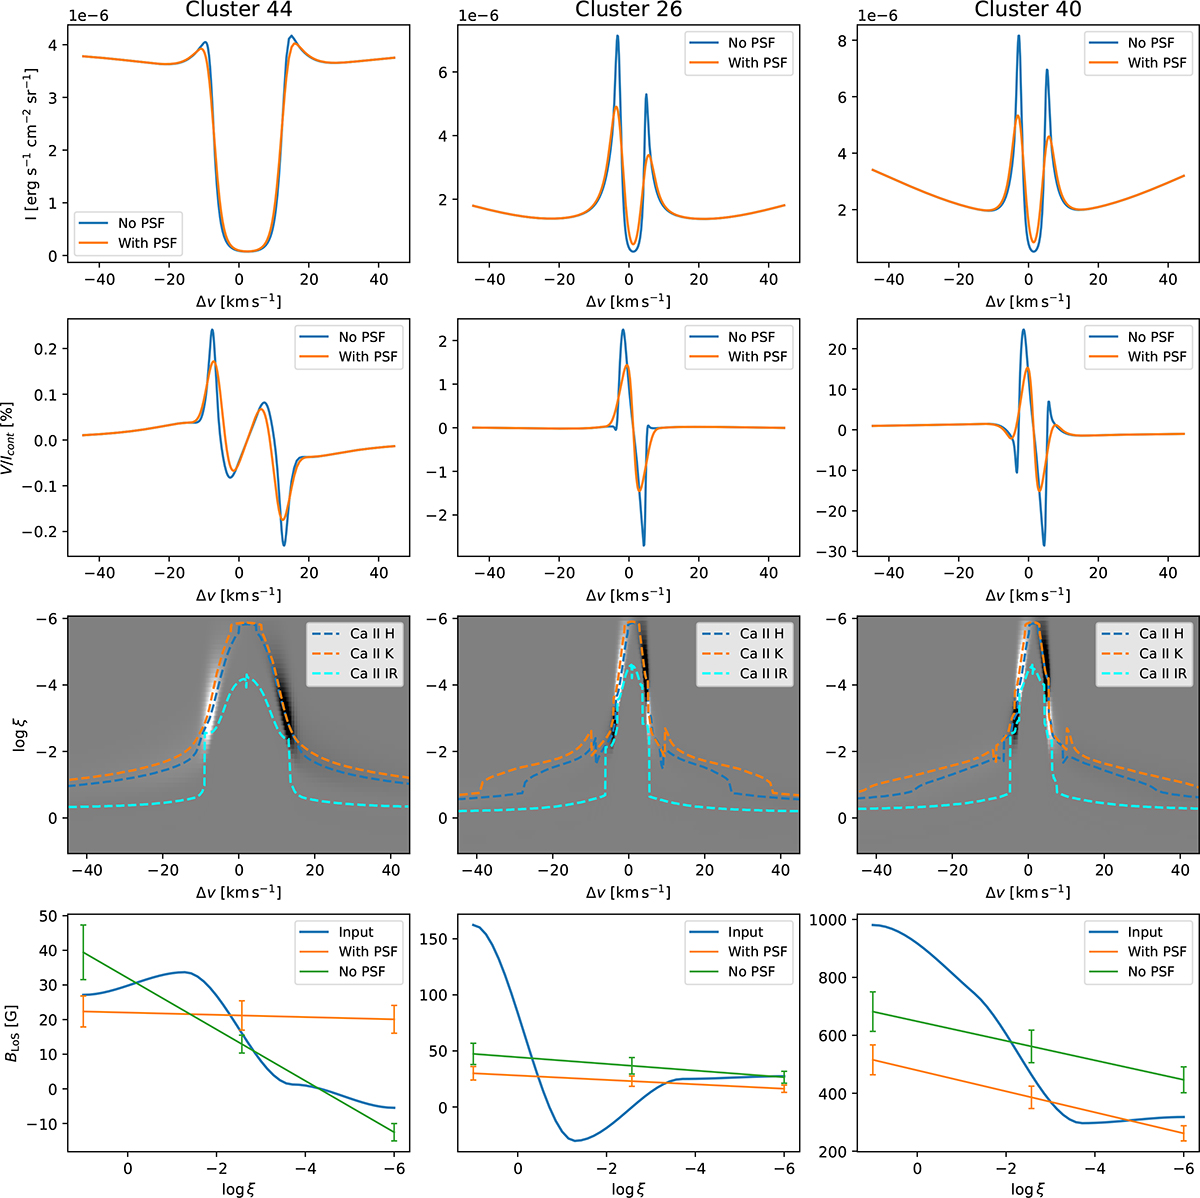
Line profiles, response functions, and magnetic fields in three representative atmosphere models. Top row: Intensity of the Ca II H line before (blue) and after (orange) being convolved with a spectral PSF of 130 mÅ. Second row: Circular polarisation of the Ca II H line before (blue) and after (orange) being convolved with a spectral PSF of 130 mÅ. Third row: Image of the response functions of Stokes V in the Ca II H line to variations of BLoS, as function of wavelength expressed as Doppler shift and column mass ξ. The three dashed curves correspond to the location on the log ξ vs Δλ space of the maxima of the response functions for the Ca II H (blue), K (orange), and 854.2 nm (cyan) lines. Bottom row: Stratification of BLoS obtained from inverting the synthesized Ca II H and K spectra compared to the input atmospheric model. Vertical lines on the bottom row represent estimations of the uncertainty of the BLoS at chosen depth points.
Current usage metrics show cumulative count of Article Views (full-text article views including HTML views, PDF and ePub downloads, according to the available data) and Abstracts Views on Vision4Press platform.
Data correspond to usage on the plateform after 2015. The current usage metrics is available 48-96 hours after online publication and is updated daily on week days.
Initial download of the metrics may take a while.