Fig. 6.
Download original image
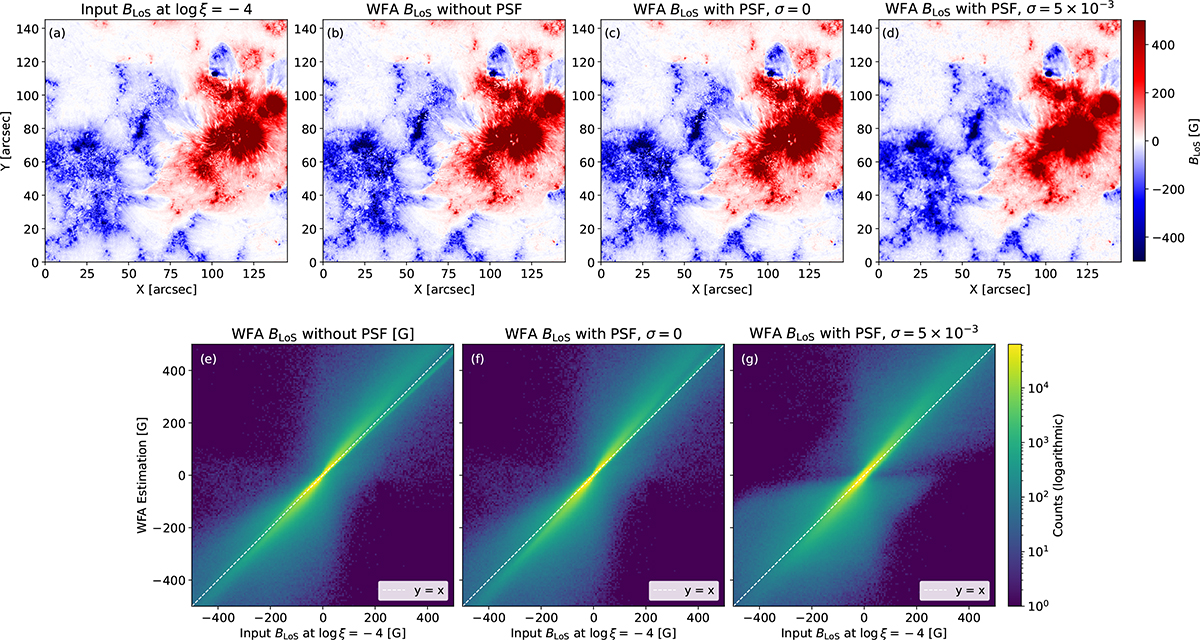
Top row: Line-of-sight magnetic field (BLoS) at log ξ = −4 from the input model (a), compared with the weak-field estimates obtained from the original synthetic spectra (b), and from the same spectra after convolution with the CHROMIS spectral PSF with (c), and without noise (d). Bottom row: Logarithmic density plots comparing the input BLoS with the weak-field results, for the case without the convolution with the PSF (e), and with the convolution with the PSF for the noiseless case (f) and the case with added noise (g). Dashed lines in the bottom row mark the identity line.
Current usage metrics show cumulative count of Article Views (full-text article views including HTML views, PDF and ePub downloads, according to the available data) and Abstracts Views on Vision4Press platform.
Data correspond to usage on the plateform after 2015. The current usage metrics is available 48-96 hours after online publication and is updated daily on week days.
Initial download of the metrics may take a while.