Fig. 1
Download original image
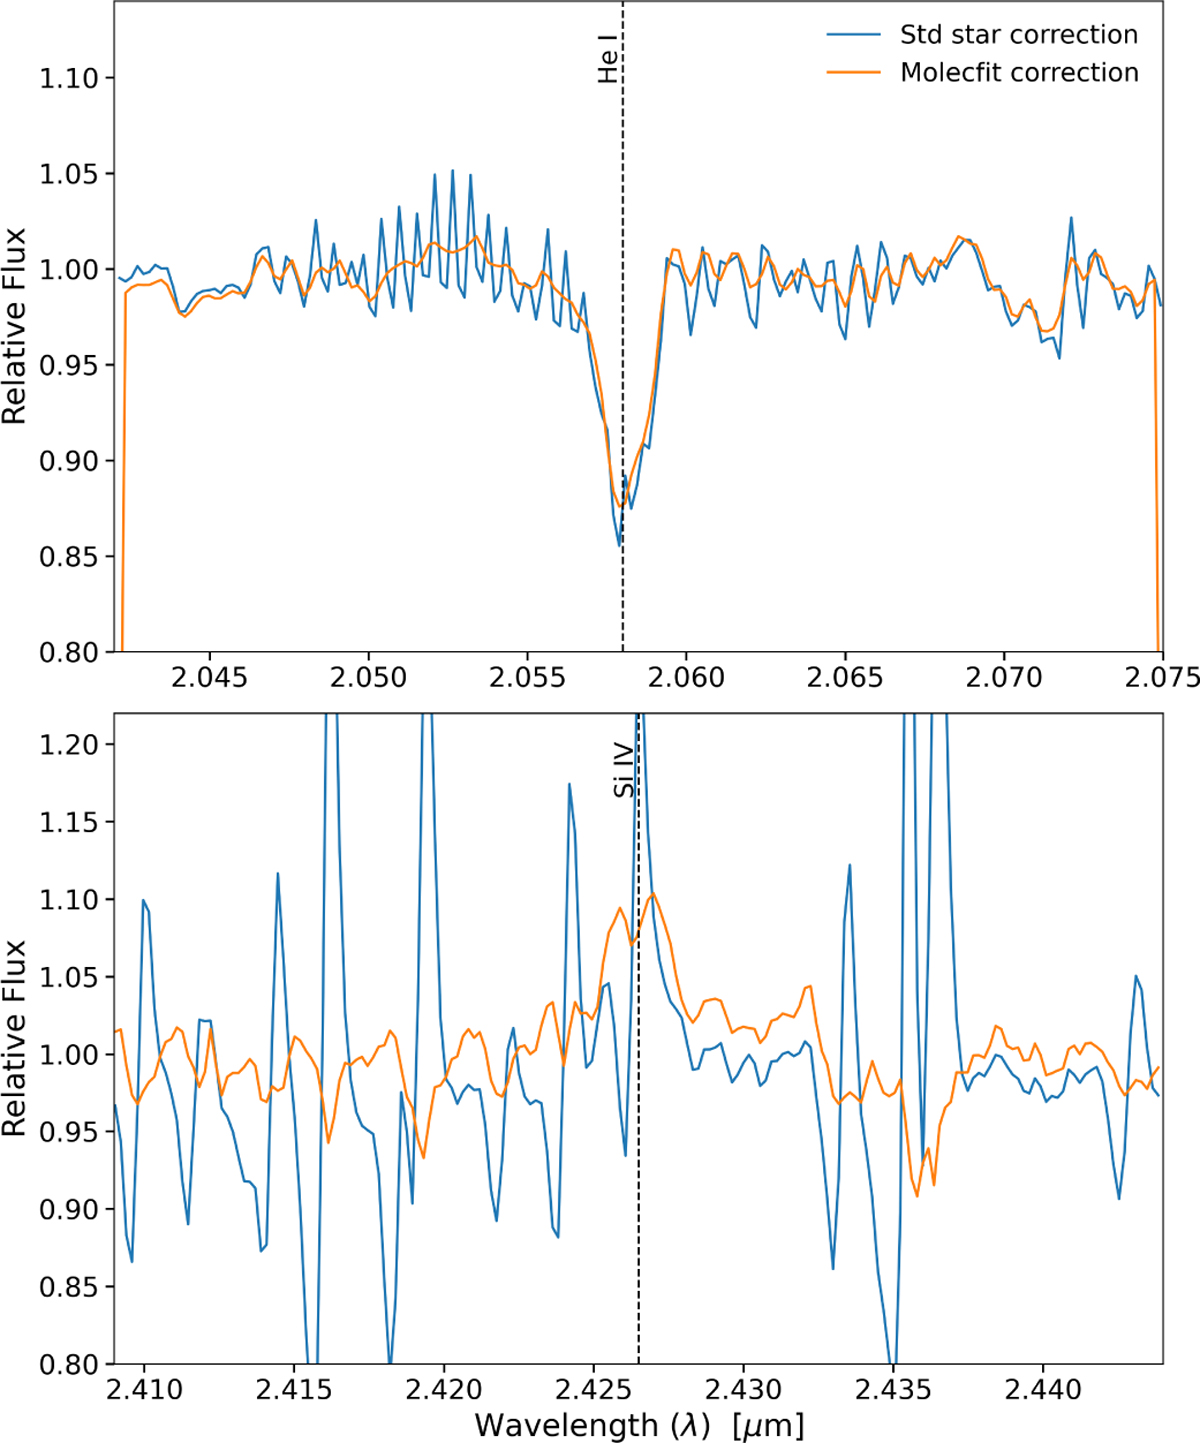
Comparison of the final, telluric-corrected science spectra obtained with the two considered methods for telluric correction, one based on a standard star (blue) and the other using Molecfit (orange). Two wavelength intervals strongly affected by telluric absorption are shown: top, 2.04-2.075 μm around the He I line at 2.058 μm; bottom, 2.41-2.45 μm around Si IV at 2.4265 μm.
Current usage metrics show cumulative count of Article Views (full-text article views including HTML views, PDF and ePub downloads, according to the available data) and Abstracts Views on Vision4Press platform.
Data correspond to usage on the plateform after 2015. The current usage metrics is available 48-96 hours after online publication and is updated daily on week days.
Initial download of the metrics may take a while.