| Issue |
A&A
Volume 708, April 2026
|
|
|---|---|---|
| Article Number | A209 | |
| Number of page(s) | 16 | |
| Section | Galactic structure, stellar clusters and populations | |
| DOI | https://doi.org/10.1051/0004-6361/202558099 | |
| Published online | 06 April 2026 | |
First spectroscopic identification of the main sequence in Westerlund 1
1
Departamento de Astrofísica, Centro de Astrobiología (CSIC-INTA),
Ctra. Torrejón a Ajalvir km 4,
28850
Torrejón de Ardoz,
Spain
2
Departamento de Física Teórica, Universidad Autónoma de Madrid (UAM),
Campus de Cantoblanco,
28049
Madrid,
Spain
3
Departamento de Física Aplicada, Facultad de Ciencias, Universidad de Alicante,
Carretera de San Vicente s/n,
03690
San Vicente del Raspeig,
Spain
4
School of Physical Sciences, The Open University,
Walton Hall,
Milton Keynes
MK7 6AA,
UK
5
Istituto Nazionale di Astrofisica (INAF) - Osservatorio Astronomico di Palermo,
Piazza del Parlamento 1,
90134
Palermo,
Italy
6
The School of Physics and Astronomy, Tel Aviv University,
Tel Aviv
6997801,
Israel
7
European Space Agency (ESA), ESA Office; Space Telescope Science Institute,
3700 San Martin Drive ;
Baltimore,
MD
21218,
USA
8
Department of Physics and Astronomy, University College London,
Gower Street,
London
WC1E 6BT,
UK
9
Square Kilometre Array Observatory (SKAO),
Jodrell Bank, Lower Withington,
Macclesfield
SK11 9FT,
UK
★ Corresponding author: This email address is being protected from spambots. You need JavaScript enabled to view it.
Received:
13
November
2025
Accepted:
24
February
2026
Abstract
Context. Being the most massive known young stellar cluster in the Milky Way, Westerlund 1 (Wd1) constitutes an ideal benchmark for understanding the evolution of massive stars. However, the cluster age remains highly controversial (∼4-10 Myr), hindering the use of Wd1 as a reference for massive star evolution. One of the main issues is a high foreground extinction, which has thus far prevented the detection of the main sequence.
Aims. Using infrared (IR) spectroscopy, we seek to detect the cluster’s main sequence for the first time, to characterise the Hertzsprung-Russell diagram (HRD), and to use the cluster’s turn-off to obtain a robust age estimate.
Methods. We obtained multi-epoch, near-IR VLT/KMOS spectroscopic observations of Wd1 to map its population of massive stars. The spectra of ∼110 members were analysed with CMFGEN models to derive the stellar parameters, populate the cluster HRD, and compare it with isochrones from evolutionary models.
Results. Our observations returned 47 new spectroscopically identified cluster members, with spectral types O9-B1 III-V. The cluster turn-off indicates an age of 5.5 ± 1.0 Myr at a distance of 4.23−0.21+0.23 kpc, displaying a moderate degree of coevality. We demonstrate that our estimate of the age of Wd1 is robust against reasonable changes in the distance and extinction law, as well as the adopted rotational velocity and metallicity of the stellar isochrones. We further find that ∼65% of the OB stars with multi-epoch coverage exhibit radial-velocity variability.
Conclusions. The IR observations of the unevolved stellar population support a single episode of star formation with an age of ∼5.5 Myr, reinforcing its potential as a benchmark for massive star evolution and providing a reference sample for future binary population studies.
Key words: stars: early-type / stars: evolution / open clusters and associations: individual: Westerlund 1
© The Authors 2026
 Open Access article, published by EDP Sciences, under the terms of the Creative Commons Attribution License (https://creativecommons.org/licenses/by/4.0), which permits unrestricted use, distribution, and reproduction in any medium, provided the original work is properly cited.
This article is published in open access under the Subscribe to Open model. This email address is being protected from spambots. You need JavaScript enabled to view it. to support open access publication.
1 Introduction
Wd1 is renowned as one of the most massive young clusters in our Galaxy. Its total stellar mass is estimated on the order of 105 M⊙ (Clark et al. 2005) and it hosts an extraordinary population of evolved high-mass stars. Notably, Wd1 contains about two dozen Wolf–CRayet (WR) stars, multiple red and yellow supergiants and hypergiants (RSGs, YSGs+YHGs), at least one luminous blue variable (LBV), and an assortment of OB supergiants. In addition, it harbours an X-ray pulsar that likely originated from a progenitor with a mass greater than 40 M⊙ (Muno et al. 2006). This rich stellar census makes Wd 1 a unique laboratory for studying the evolution of very massive stars and the formation of compact end-products in a dense cluster environment.
Despite its importance, Wd1 has been historically challenging to observe and interpret. Discovered by Westerlund (1961), Wd1 remained largely unstudied for decades due to foreground extinction (AV ≈ 11-13 mag), which rendered it practically inaccessible to early optical surveys (Negueruela et al. 2010; Damineli et al. 2016). Reaching down to a magnitude of V ≈ 20, Clark et al. (2005) still detected only evolved, luminous stars, with no trace of the cluster’s main sequence members.
Infrared (IR) observations have been essential to overcome these limitations. By operating at wavelengths less affected by dust, near-IR (NIR) surveys began to unveil Wd1’s hidden members that optical observations missed. NTT/SOFI JHK spectroscopy of the bright evolved WR population enabled the classification of these objects (Crowther et al. 2006). Brandner et al. (2008) detected the intermediate- and low-mass populations of Wd1 using deep NIR photometry, while recent James Webb Space Telescope (JWST) observations have even begun to identify sub-solar mass members and protostellar disks by peering through Wd1’s dust (Guarcello et al. 2025). Complementary to these studies, the Extended Westerlund 1 and 2 Open Clusters Survey (EWOCS) collaboration is conducting a coordinated optical, IR and X-ray campaign to extend the census from substellar objects up to the most luminous WR stars (Guarcello et al. 2024; Anastasopoulou et al. 2024).
This collection of increasingly comprehensive optical and IR spectroscopy has laid the groundwork for quantifying Wd 1’s stellar content and fundamental parameters. An initial 4-5 Myr age estimate was derived from the coexistence of ~24 WR stars with four red supergiants and a substantial population of yellow and blue hypergiants (Crowther et al. 2006; Negueruela et al. 2010). Optical spectroscopy has confirmed ~200 bright post main sequence cluster members (Clark et al. 2005) and subsequent surveys in the I - and R - bands have filled out the luminous census, revealing a smooth sequence from O9III giants to BI supergiants and finding no evidence for an older population (Clark et al. 2020). These data reinforced the interpretation of Wd1 as a roughly coeval ensemble about 5 Myr old, with binary interactions likely playing an important role in explaining the cluster’s large cohort of hypergiants (Clark et al. 2011, 2020).
However, recent studies have cast doubt on the ~5 Myr age. Applying a revised, steep optical-IR reddening curve specific to the cluster sightline (Damineli et al. 2016), Beasor et al. (2021) found that Wd 1’s cool supergiants are ~0.4dex too faint for a 5 Myr isochrone, favouring a ~10 Myr age. While age estimates based on the relative numbers of evolved stars were independent of distance and extinction, analyses relying on luminosities or positions on the Hertzsprung-Russell diagram (HRD) are highly sensitive to these parameters.
Recent distance estimates in the literature range from d ≃ 2.8 to 5 kpc. A Bayesian analysis of the Gaia EDR3 parallaxes yields  kpc (Aghakhanloo et al. 2021). The location of the pre-main sequence in the NIR colour-magnitude diagram yields 3.6 kpc (Brandner et al. 2008) and 3.8 kpc (Lim et al. 2013). Independent constraints are derived from eclipsing binaries: The modelling of W13 binary system yields 3.7 ± 0.6 kpc (Koumpia & Bonanos 2012) and a proper-motion-selected sample of OB binaries in Gaia DR2
  kpc (Davies & Beasor 2019). Based on Gaia EDR3 proper motions and an improved parallax zero point, Negueruela et al. (2022) derived a distance of
  kpc, in better agreement with early spectrophotometric studies that favoured ~5kpc (Clark et al. 2005; Crowther et al. 2006) when systematic effects are considered. The sightline extinction, meanwhile, spans AV ≃ 10-12 mag with marked spatial variation (Andersen et al. 2017). Considering the outstanding discrepancies in distance and reddening, the age of Wd1 remains unsettled.
The motivation for our present study is to overcome the observational limitations that have so far restricted our understanding of Wd1. We seek to peer through the heavy dust extinction that hinders optical surveys and capture the NIR spectra of Wd1’s main sequence massive stars for the first time.
Our objectives are to assess the full cluster population, derive a refined age for Wd1, clarify its evolutionary state, thereby resolving the current age and distance discrepancies and cementing Wd1’s role as a cornerstone of massive-star evolution. In the following sections, we describe the observations and data reduction (Sect. 2), the spectral analysis and stellar-parameter determination (Sect. 3), and the construction of the HRD and age estimate (Sect. 4). Finally, we discuss the broader implications (Sect. 5) and summarise our main conclusions (Sect. 6).
Summary of the VLT/KMOS observing campaigns.
2 Observations and data reduction
2.1 VLT/KMOS observations
Spectroscopic observations were obtained with the K-band Multi Object Spectrograph (KMOS; Sharples et al. 2013) mounted on ESO’s Very Large Telescope (VLT), through two separate observing programmes: a single-epoch campaign during Period 109 (P109, PI: R. Castellanos), and a multi-epoch followup in Period 113 (P113, PI: R. Castellanos). Both campaigns employed similar instrumental setups and observational strategies, allowing them to be combined into a uniform dataset.
KMOS’s 24 deployable integral field units (IFUs) allow for the simultaneous observation of multiple targets within the ~4′ field of view. The IFUs are specifically allocated to programme candidates (Sect. 2.2), thereby avoiding source crowding.
In P109, a total of ~150 stars were observed across ten individual KMOS configurations. Each configuration was observed once, with spectroscopy acquired in the YJ, H, and K bands, with a spectral resolving power of R(λ/∆λ) ~ 3400, 3900, and 4200, respectively.
In P113, a subsample of ~90 stars was subject to further observation using five different KMOS configurations. Each configuration was repeated up to five times in order to enable the detection of radial velocity variability indicative of binarity. To maximise the signal-to-noise ratio (S/N), since NIR spectral lines are intrinsically weak in main sequence stars, this campaign was restricted to the YJ and H bands.
Observations in both programmes were conducted in service mode under excellent seeing conditions (<0.8″), using an ABA dither pattern with offset sky positions for optimal background subtraction. Exposure times were tailored to source brightness, with detector integration times (DITs) ranging from 6 s to 196 s per exposure, and 4-5 exposures per grating. A summary of the observational setup and parameters for both programmes is provided in Table 1.
2.2 Sample selection
Targets were selected from the NIR photometric catalogue of Gennaro et al. (2011), based on SOFI/NTT observations, providing JHK photometry suitable for identifying both bright evolved stars and fainter unevolved candidates. From the ~150 KMOS spectra obtained, we discarded stars whose S/N levels were not sufficient (typically below 100) to reliably measure the weak diagnostic lines available in the observed bands. As we are mainly interested in the less evolved population of the cluster in this work, we have excluded most of the known WR stars as well as double-lined spectroscopic binaries. This resulted in a sample of 109 stars for the analysis in this work (see Table A.1 and Fig. 4).
The sample includes two main groups. Approximately 60 stars correspond to previously known cluster members that have been spectroscopically classified at optical wavelengths, primarily from the VLT/FLAMES survey by Clark et al. (2020). These objects constitute a reference population of evolved massive stars.
The remaining ~50 stars had been selected as candidate main sequence members using photometric criteria designed to isolate early-type OB stars behind the strong extinction affecting Wd1. Specifically, we applied the following selection criteria, J > 12 mag and 1.2 < J - K < 1.5, guided by the observed magnitudes of previously classified supergiants and giants in the cluster. They were further chosen to minimise contamination from foreground sources and evolved stars.
2.3 Data reduction and telluric correction
All spectroscopic data were reduced using the standard esoreflex KMOS pipeline (SPARK, Davies et al. 2013) in the ESO Reflex automated data reduction environment (Freudling et al. 2013). This workflow includes flat-field correction, wavelength calibration, bad pixel masking, cube reconstruction, and extraction of one-dimensional (1D) spectra from the IFUs. The same reduction strategy was applied to both the single-epoch (P109) and multi-epoch (P113) observations to ensure consistency across the dataset. A critical step in the reduction process was the correction of telluric absorption features, particularly severe in the NIR due to strong water vapour bands. Two methods were tested for telluric correction: the classical standard-star approach and the Molecfit software.
In the first approach, early-type standard stars (preferentially A0V) were observed at airmasses similar to those of the science targets, either immediately before or after the science observations. These standards, with nearly featureless continuum in the NIR, were used to derive telluric transmission spectra after modelling and removing their intrinsic stellar lines. These spectra were then used to remove the telluric absorption from the science spectra.
The second approach makes use of Molecfit (Smette et al. 2015), which fits synthetic atmospheric transmission models directly to the observed spectra. This method has proven highly effective for VLT/KMOS data, especially in cases where sky conditions were variable or the quality of standard-star observations was limited.
In all our tests, Molecfit consistently yielded lower residuals around key diagnostic lines and was therefore adopted for the final analysis. Figure 1 compares the resulting corrected spectra using the two methodologies described.
3 Spectroscopic analysis
3.1 NIR spectral classification
Spectral types were assigned through visual comparison against reference standards ranging from O9 to B2, encompassing all luminosity classes. The primary reference grid consists of standard stars established by Negueruela et al. (2024). Archival near-IR VLT/X-SHOOTER spectra were retrieved, continuum-normalised, and convolved to KMOS resolution, enabling a direct comparison of their line profiles against our targets. We also considered the medium-resolution atlas of OB stars by Hanson et al. (2005), whose spectra cover the H and K bands. Finally, the grid was complemented with additional VLT/X-SHOOTER spectra of O9-B2 stars classified in the optical range.
The classification was performed mainly based on the observation of hydrogen and helium lines that exhibit variations with spectral subtypes in the IR spectrum. In the J band, we inspected the Paschen series (Pa δ, Pa γ), together with the He I 1.083 μm, He I 1.092 μm, and He I 1.278 μm lines. Due to the variable spectral coverage across the KMOS IFUs, the He II 1.012 μm line lies at the edge of the J-band range and is only detected in a few spectra; thus, it was not used for classification purposes. In the H band, the classification relied on Br 10-12, He I 1.70 μm, and He II 1.69 μm. In the K band, we considered Br γ alongside He I 2.161 μm, He I 2.058 μm, and the HeI 2.112/3 μm doublet, which overlaps with the CIII/NIII/OIII 2.115 μm complex and Si IV 2.426 μm lines. Examples of the J - and H-band spectra of our sample are shown in Fig. 2. New dwarf-type members exhibit the deep and broad Brackett and Paschen profiles characteristic of this luminosity class. Our new classification revisits the optical types previously assigned by Clark et al. (2020) for ~60 stars, confirming the overall reliability of their scheme while refining several cases. In most instances, the NIR classifications derived here agree within half a subtype with the optical types proposed by Clark et al. (2020).
The ~50 newly classified objects have been appended to the known cluster census (Table 2) and, together with the OB members described in Sect. 2.2, they form the final sample used for the derivation of the fundamental stellar parameters (detailed in Sect. 3.3). The assigned spectral types are listed in Table A.1.
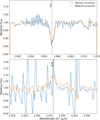 |
Fig. 1 Comparison of the final, telluric-corrected science spectra obtained with the two considered methods for telluric correction, one based on a standard star (blue) and the other using Molecfit (orange). Two wavelength intervals strongly affected by telluric absorption are shown: top, 2.04-2.075 μm around the He I line at 2.058 μm; bottom, 2.41-2.45 μm around Si IV at 2.4265 μm. |
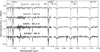 |
Fig. 2 Normalised J - and H-band spectra of four newly classified OB members of Westerlund 1, offset vertically for clarity. Object IDs and adopted spectral types are indicated on the left. Principal diagnostic lines used for the spectral classification include Pa δ, Pa γ, He I 1.083 μm, He I 1.092 μm, He I 1.278 μm, Br 10-12, He II 1.692 μm, and He I 1.700 μm. |
Stellar demographics of Wd1 updated from (Clark et al. 2020).
3.2 Radial velocity analysis
Our multi-epoch KMOS observations enable a first-order search for spectroscopic binaries by monitoring radial-velocity (RV) changes between different observing epochs. The J- and H-band spectra were aligned in wavelength using NIR diffuse interstellar bands (DIBs) available in both regions. In particular, the DIB at 1.317 μm in J-band and the one at 1.527 μm in H-band were fitted with a Gaussian profile in each epoch. Individual spectra were then shifted to place the DIB centroid at a common rest wavelength, as shown in Fig. 3.
Once aligned, relative radial velocity variations were measured from the Doppler shift of the strong stellar absorption lines He I 1.700 μm line in H-band. The He I diagnostic lines in the J-band were discarded because they experience higher noise and are contaminated by DIBs in some cases. Gaussian profiles were fitted to the line cores in each epoch, deriving the central wavelengths.
In Table A.1, candidate spectroscopic binaries are flagged if both of the following criteria are fulfilled: (i) the spectra display a peak-to-peak variation exceeding ∆RV > 20 km s−1 following previous work on OB star surveys (e.g. Sana et al. 2013); and (ii) the variation reaches a significance level of ∆RV ≥ 4σ (Bodensteiner et al. 2021). We find that 63.1% of the OB stars with multi-epoch coverage are flagged as RV variable. This fraction exceeds that reported from optical FLAMES data (Ritchie et al. 2022)1, which could be explained as follows: on the one hand, the optical sample is dominated by evolved supergiants, whose larger radii imply wider orbits and smaller RV amplitudes. On the other hand, the optical sample could also include post-interaction systems. Table A.1 also includes the additional confirmed or candidate binaries compiled by Ritchie et al. (2022). A deeper analysis of binary aspects aiming at deriving the intrinsic binary fraction and placing constraints on the underlying period and mass-ratio distributions will be presented in a forthcoming study.
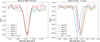 |
Fig. 3 Zoom over the spectra used for the radial-velocity measurement of Wd1-1048. Coloured lines correspond to epochs as indicated in the legend. Left: DIB 1.527 μm absorption in the five epochs, adopted as wavelength reference (vertical red dashed line marks the rest frame wavelength). Right: He I 1.70 μm line in the five epochs after realigning the spectra. Wd1-1048 is a known RV variable and possible eclipsing binary (Ritchie et al. 2022). |
3.3 CMFGEN model fit
To derive the fundamental stellar parameters of effective temperature (Teff) and bolometric luminosity (L*) for the observed sample, we fit each observed spectrum against a precomputed grid of ~5000 non-LTE, line-blanketed model atmospheres generated with the CMFGEN code (Hillier & Miller 1998). For stars with multi-epoch observations, the individual spectra were shifted to the same reference frame and co-added in order to increase the S/N before performing the CMFGEN fitting.
The CMFGEN grid utilised in this study samples the parameter space that is relevant for late O- and early B- type stars in Wd1. In practice, the grid encompasses effective temperatures ranging from 15 000 to 40 000 K with a nominal step of roughly 1 000 K. Additionally, surface gravities are covered from log g = 2.5 to 4.0 (cgs) with a typical increment of approximately 0.15 dex, while including models computed for both solar and slightly metal-rich compositions. Each model spectral energy distribution (SED) was computed from 0.3 to 5 μm, covering the wavelength range of the KMOS observations.
Each observed KMOS spectrum was first continuum normalised by fitting a low-order spline to carefully selected line-free regions across the J, H, and K bands. Using the He I 1.700 μm line in the H band as reference, the projected rotational velocity (vsin i) and the radial-tangential macroturbulent velocity (vmac) were empirically constrained. These parameters were varied in discrete steps and the combination providing the best agreement between a reference model and observations was adopted. These resulting values, along with the instrumental resolution, were then used to convolve all CMFGEN models.
We compared each observed, normalised spectrum against the CMFGEN grid, by using the reduced chi squared metric,
![Mathematical equation: \chi^2_\nu=\frac{1}{N_{\mathrm{pix}}-p} \sum_{i=1}^{N_{\mathrm{pix}}} \left[\frac{F_{\mathrm{obs}}(\lambda_i)-F_{\mathrm{mod}}(\lambda_i)} {\sigma_i}\right]^2 ,](/articles/aa/full_html/2026/04/aa58099-25/aa58099-25-eq5.png)
where Fobs and Fmod are the observed and model fluxes, σi is the per-pixel uncertainty, Npix the number of wavelength points considered, and p the number of free parameters. The fit was restricted to windows that contain the main diagnostic features such as Pa γ and Paβ in the J band; Brackett lines and He I 1.70 μm in the H band; and Br γ together with He II 2.188 μm in the K band, while regions contaminated by strong telluric residuals or poor S/N were masked out to avoid biases.
The model yielding the minimum  was adopted as the best fit. This choice was subsequently visually validated by superposing the full J+H+K synthetic spectrum on the data. The visual inspection confirmed the quality of the fit across all key lines and flagged composite or otherwise peculiar spectra (e.g. asymmetric profiles or excessive broadening) that might indicate unresolved binaries. In order to estimate the statistical uncertainties we examined the χ2 distribution across the model grid. For each star, we computed the associated p-values and defined the 1σ confidence range in Teff and log g. This typically yielded uncertainties of roughly ±1000 K and ±0.15 dex in log g, depending on the spectral type and S/N ratio. Representative examples of this procedure are provided in Appendix B, where we compare the observed key diagnostic lines of our targets with the best-fit CMFGEN model.
3.4 Extinction correction and stellar luminosity
Stellar luminosities were calculated by rescaling the CMF-GEN model SED until it reproduced the de-reddened SOFI JHKs photometry. For this calculation, we adopted a distance of  kpc from Negueruela et al. (2022), derived from Gaia EDR3 parallaxes of kinematically selected Wd1 members and carefully accounting for the foreground population along this sightline. The uncertainty in distance propagates into a systematic uncertainty of ≃ ± 0.04 dex in log L*. For every star, the best-fitting CMFGEN spectral energy distribution was convolved with the SOFI JHKs response curves to obtain intrinsic model magnitudes (
 ). The colour excess E(J - K) was computed from the difference between the observed and intrinsic model colours. Using the extinction law of Hosek et al. (2018), we derived AK and obtained the corresponding de-reddened magnitudes, finding a mean extinction of AK = 0.69 ± 0.07 mag, AH = 1.37 ± 0.14 mag and AJ = 2.47 ± 0.25 mag. The Damineli et al. (2016) extinction law would instead yield AK = 0.8 ± 0.08, AH = 1.44 ± 0.15, and AJ = 2.62 ± 0.28 mag. The large standard deviation of our results reflects that internal reddening is not negligible in the cluster. We also note the larger average extinction in the J-band compared to the Damineli et al. (2016) average AJ = 2.34 value.
After correcting the observed photometry for extinction, the stellar radius (R*, defined at optical depth τ = 2/3) was determined by scaling the model flux to match the de-reddened K-band magnitude at the adopted distance. The corresponding bolometric luminosity L* was then obtained from the Stefan-Boltzmann law using the spectroscopic Teff. The resulting Teff and L* values, listed in Table A.1, offer a good match to the expected parameters for the spectral types of the analysed stars.
Uncertainties in luminosity were derived by propagating the errors in Teff from our analysis, along with those taken from Negueruela et al. (2022) to account for the errors in distance. The resulting uncertainties in log L* are typically ~0.1 dex across the sample. A detailed discussion on the impact of the adopted distance in the interpretation of the HRD is presented in Appendix C. Further uncertainties may also arise from unresolved companions, which we also discuss in following sections.
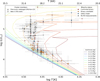 |
Fig. 4 HRD for the observed sample in Wd1. The colour of the symbols encodes the binary status based on RV measurements: confirmed binaries from Ritchie et al. (2022, red), candidate binaries identified in this work (orange), likely single stars (blue), and stars without RV measurements (grey). The shape of the symbols indicates whether the star had been analysed previously by Ritchie et al. (2022, triangles), while circles mark stars analysed for the first time in this work. Z = 0.02 isochrones (Yusof et al. 2022) for ages log t [yr] = 6.0-7.0 are overplotted (coloured curves). |
4 HRD construction
Using the  kpc distance value proposed by Negueruela et al. (2022) and the NIR extinction law of Hosek et al. (2018), we constructed the HRD for Wd1 with the stellar parameters compiled in Table A.1. Figure 4 shows the resulting HRD, where we overlaid the Geneva evolutionary isochrones for ages ranging from 1 to 10 Myr in 0.1-dex steps. An enriched metallicity of Z = 0.020 was adopted, motivated by the elemental abundances derived for the cluster’s LBV Wd1-243 by Ritchie et al. (2009). The uncertainties on Teff and L*, shown as error bars in Fig. 4, remain smaller than the spacing between neighbouring isochrones near the turn-off, ensuring a robust age determination within 0.1 dex.
The distribution of the cluster members reveals a well-defined main sequence, accompanied by the expected sequence of evolved giants and supergiants. The total number of considered stars is 109, of which 47 are newly identified O9-B0 III-V down to B1 V stars. The remaining objects of the sample are previously known evolved giant and supergiant stars. The unevolved stars form a diagonal band in the HRD, spanning Teff ~ 25 000-30 000 K and log(L*/L⊙) ~ 4.3-4.8. The stars at the turn-off are spectroscopically classified as late-O to early-B giants, matching the spectral type for the predicted turn-off of an 5.5 Myr population: Teff ≈ 31 000 K and log(L*/L⊙) ≈ 4.9. Most evolved stars are characterised by slightly cooler temperatures (−23 000-27 000 K) and higher luminosities, consistent with the post-main sequence tracks of −30-40 M⊙ stars.
The cluster’s stars mostly gather between the 5-6.3 Myr isochrones. In particular, the hottest giant stars are found near the 5 Myr track and the luminous cool supergiants also coincide with the same age, strengthening a self-consistent single-population solution. The 5-6.3 Myr turn-off is a more suitable match than any older age. For example, a 10 Myr isochrone would run significantly cooler and fainter than the observed main sequence turn-off (by ∆Teff −6000 K and ∆ log L* - 0.5 dex). Hence, we estimated a cluster age of 5.5 ± 1.0 Myr. We did not find inconsistencies or signatures in the HRD that would suggest the presence of an additional, non-coeval population. This point is further explored in Sect. 5. We emphasise that it was only with the adopted distance of  kpc that we were able to achieve such a consistency, as a shorter distance would fail to reproduce the luminosities of both the unevolved and evolved members simultaneously. We address this in detail in Appendix C.
We also looked into possible biases in the position of stars due to multiplicity. The RV variability of our targets (see Sect. 3.2) is indicated in Fig. 4. Stars lacking RV information are denoted by black triangles, while red symbols indicate previously identified variables from Ritchie et al. (2022). A small number of the RV variable stars in the main sequence lie slightly above the 6.3 Myr single-star isochrone on the HRD, which is consistent with unresolved binaries whose combined flux results in increased luminosity. If fluxes were de-blended, the corresponding points would shift to a slightly lower luminosity.
To verify the 5.5±1.0 Myr age, we also considered the most evolved cluster members. The presence of WRs in the cluster has been firmly established by previous studies (e.g. Clark et al. 2005; Crowther et al. 2006; Beasor et al. 2021; Anastasopoulou et al. 2024). Single stellar evolution theory predicts that, at ~5.5 Myr, stars with initial masses above ~40-50 M⊙ will have already evolved into WRs or ended their lives (Ekström et al. 2012; Yusof et al. 2022). This is consistent with the presence of a magnetar in the cluster reported by Muno et al. (2006), while stars with slightly lower masses (~20-25 M⊙) are expected to be entering the red supergiant phase. Our age estimate of −5.5±1.0 Myr at a distance of  kpc remains compatible with the broader stellar population of the cluster, underpinning the age and fundamental parameters of Wd1.
The impact of adopting different values for distance, extinction, metallicity, and rotational velocity is explored in detail in Appendix C. We find that even when the largest plausible variations of these parameters are applied, the resulting shift is limited to a few tenths of a dex in log L* and to less than 1 Myr in age, well within the adopted systematic uncertainties.
5 Discussion
Westerlund 1’s age ranges between −4 Myr and >10 Myr in the literature. Early analyses that relied exclusively on evolved stars consistently portrayed Wd1 as a very young cluster. Clark et al. (2005) noted the absence of O-type dwarfs in optical surveys and inferred an age of 4-5 Myr. The ratio of WR versus cool supergiants led Crowther et al. (2006) to a formal age of −4.5-5 Myr, and spectroscopy of −50 OB supergiants by Negueruela et al. (2010) likewise favoured a single, coeval population of at least 5 Myr. These studies portrayed Wd1 as a young, massive analogue to the Quintuplet cluster, with its abundant WR stars and first red supergiants displaying full compatibility with a single episode of star formation occurring −5 Myr ago. Our NIR study can now confirm this scenario.
More recent works have challenged this view by focussing on the cool supergiant population. Beasor et al. (2021) reanalysed the four red supergiants in Wd1 by integrating their observed spectral energy distributions, combining new SOFIA mid-IR (MIR) photometry with archival optical and NIR data. Their derived luminosities were too low to be reproduced by 5 Myr isochrones. Instead, they argued that the RSGs are better matched by an older age, with a best-fit value of  Myr, suggesting that Wd1 might be significantly older than previously thought; alternatively, they posited that it might be host to multiple stellar generations. Under this interpretation, the progenitors required to form the 20 or so luminous WR stars observed in Wd1 should already have exploded, thus requiring a second, younger population to explain their presence in the cluster. Nonetheless, until now it was difficult to refute the older-age hypothesis because the main sequence had not been directly detected.
The HRD in Fig. 5 brings our KMOS OB sample together with all the evolved stars that have shaped the age debate and for which the stellar parameters have been published: the full WR population (Crowther et al. 2006; Rosslowe 2015), the RSGs and YSGs analysed by Beasor et al. (2021), the blue-straggler hypergiants Wd1-27 and Wd1-30a (Clark et al. 2019), the extremely luminous LBV Wd1-243 (Ritchie et al. 2009), and the binaryinteraction product Wd1-5 (Clark et al. 2014). For the YSG stars, Fig. 5 also includes the luminosity estimated by Clark et al. (2020), who actually considered them as YHG stars (shown as an open square). All luminosities have been scaled to the adopted distance of  kpc. Following the alignment of the luminosities on a uniform distance scale, a discernible pattern becomes apparent. The majority of evolved stars are consistent with the −5-6 Myr age range. Conversely, the blue stragglers are situated well above the 5-6 Myr turn-off, which is consistent with rejuvenation through binary mass transfer or merger.
As shown in Fig. 5, a few RSGs published by Beasor et al. (2021); Beasor et al. (2023) fall along the −10 Myr isochrone when their luminosities are rescaled to  kpc, while the brightest RSGs could still be reconciled with a younger 6.3 Myr solution. We note that the location of the cool supergiants (RSGs and YSG+YHGs) in the HRD is very sensitive to the method used to estimate their luminosity, and to the adopted individual extinction correction as differential reddening is significant in Wd1. This is further discussed in Sect. 5.1.
Beyond the spectro-photometric results discussed above, independent dynamical constraints within Wd1 further support a young, coeval solution. The systems W13, WR-B, and W44/L require primary masses of order ~40M⊙ (Ritchie et al. 2010), consistent with the −5-6 Myr main sequence turn-off.
Our detection of a well-populated main sequence provides direct evidence that addresses the long-standing debate over its age. The sample of late-O and early-B type stars reported in this work (Fig. 5) defines a clear turn-off at −5-6.3 Myr, with no indication of the older, fainter turn-off that would correspond to a 10 Myr population. For example, we do not observe a population of B-type supergiants at the luminosities and temperatures expected for such ages. This is consistent with the fact that no main sequence star hotter than −26 000 K would be expected at 10 Myr. Even when allowing for uncertainties in distance or extinction, the observed stars are too hot and too luminous to be compatible with a 10 Myr solution.
Our findings also align with other recent studies that have pointed back towards a younger age. Negueruela et al. (2022) derived a distance of  kpc and an age of −5-6 Myr for Wd1, which is consistent with our results. We also note that Beasor et al. (2021) reported a population of pre-main sequence stars with an estimated age of −7 Myr, which is broadly consistent with our derived age within the uncertainties. By reaching the main sequence, our work shows that the age inferred from the hot stars and the age inferred from the more luminous stars can be reconciled. The combined HRD (Fig. 5) is consistent with a single −5.5 Myr burst of star formation. We find no need to include an older (−10 Myr) population in Wd1.
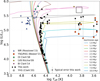 |
Fig. 5 HRD of Westerlund 1 that combines the ~110 OB stars analysed in this work (black circles) with selected evolved members from the literature. Representative error bars for the blue stars in this work are provided at the bottom. Blue triangles denote WR stars2 (Rosslowe 2015), while orange squares mark yellow and red supergiants (Beasor et al. 2021). Black squares show the YSG and RSG luminosities recalculated in this work (Sect. 5.1). Grey dashed lines connect each star to its value given in Beasor et al. (2021), illustrating the offset between both approaches. Green diamonds correspond to the bluestraggler hypergiants Wd1-27 and Wd1-30a (Clark et al. 2019). The luminous-blue-variable Wd1-243 is shown as a yellow cross (Ritchie et al. 2009). Finally, the supergiant Wd1-5 appears as a magenta inverted triangle (Clark et al. 2014). The region where YHGs would lie, following the luminosities proposed by Clark et al. (2020), is indicated by an empty black square. All literature luminosities have been rescaled to the distance adopted here of |

5.1 YSGs+YHGs and RSGs luminosities
The YSG+YHG and RSG populations in Wd1 have been central to the ongoing discussion regarding the cluster’s age. Beasor et al. (2021); Beasor et al. (2023) derived lower luminosities for these stars (by −0.5 dex) than those originally obtained by Clark et al. (2005), leading them to propose that the cool supergiants trace an older (−10 Myr) population within the cluster.
These differences primarily arise from the adopted methodology. Clark et al. (2005) relied on the empirical correlation between the OI 7774 Å line equivalent width and the absolute visual magnitude (MV), and adopted BCV = 0, a hypothesis supported by classical bolometric correction scales for A-F supergiants with similar spectral types (e.g. Humphreys & McElroy 1984; Flower 1996). Instead, Beasor et al. (2021) derived the stellar luminosities by integrating the de-reddened SED. They reconstructed the SED by joining observed NIR and MIR photometry with estimated optical and NIR fluxes inferred from intrinsic colour calibrations, along with a black-body function to account for the flux blueward of the U band. While this procedure may work for RSGs, it is not suited for warmer YSGs and YHGs (Teff ~ 6800-8500 K), as their SED peaks at shorter wavelengths (λ < 0.5 μm). Furthermore, rather than deriving line of sight extinctions for individual stars, they adopted a fixed AK = 0.74 ± 0.08 value, corresponding to the cluster average extinction from Damineli et al. (2016). As a consequence, the resulting inferred luminosities will be highly sensitive to how the optical flux is reconstructed and to the adopted extinction. The observed large range of NIR colours (1.8 ≲ (J - K)obs ≲ 3.5) displayed by the cool supergiants in Wd1 (Navarete et al. 2022) is indicative of both high and significant differential reddening across the cluster.
We thus re-evaluated the luminosities of the YSG+YHG and RSG stars using a homogeneous, NIR-based approach. We made use of available JHKs photometry (Navarete et al. 2022). For each star, we used the spectral types from Clark et al. (2020), and Navarete et al. (2022) and we adopted the Teff from either spectral type versus Teff calibrations in the literature or direct Teff determinations when available (Levesque et al. 2005; Arévalo 2018; Navarete et al. 2022). Bolometric corrections and intrinsic colours corresponding to the adopted Teff were then obtained from the YBC database (Chen et al. 2019)3. We estimated the extinction for each star from its observed NIR colour excesses, E(J - Ks), E(J - H) and E(H - Ks), adopting the extinction ratios from Hosek et al. (2018). Because results can differ due to photometric uncertainties, we adopted, for each star, the mean values of AJ, AH and AKs derived with the available colour combinations. Finally, we computed the bolometric magnitudes in each available band, converted them into luminosities, and adopted the mean value as our final luminosity estimate. We assumed the cluster distance of  kpc. The derived extinction towards individual objects, and the adopted effective temperatures and the luminosity used in Fig. 5 are provided in Table 3. We verified that adopting the extinction law of Damineli et al. (2016) yields luminosities consistently larger by −0.04 dex. With this method, the four RSGs span log(L/L⊙) ≃ 5.0-5.4, in excellent agreement with the values derived by Navarete et al. (2022). Their location in the HRD is consistent with our derived age for Wd1 and no longer requiring an older (~10 Myr) solution. For the YSG+YHGs our method yields higher luminosities than those reported by Beasor et al. (2021), placing these stars between the 5 and 6.3 Myr isochrones in Fig. 5. This supports a young, coeval population consistent with the main sequence turn-off age inferred in this work.
The observed YSG-to-RSG ratio in Wd1 is inconsistent with single star evolutionary models, which predict more RSGs than YSGs given the longer duration of the RSG phase. This discrepancy is further driven by the few YSGs produced by the models. In addition, the exact number of YSG+YHGs is sensitive to the definition of these objects (by some standards, W16a could be counted as a BSG). Finally, at the young age derived here (−5.5 Myr), the progenitors of these stars have initial masses ≥30 M⊙, for which the RSG phase is very short and model predictions are highly uncertain (Ekström et al. 2012). Instead, we suggest that the population of YSGs and RSGs in Wd1 is heavily influenced by binary physics, and that their relative distribution is not a good indicator of the cluster age. Indeed, Wang et al. (2025) demonstrated that stellar mergers can drastically alter the luminosity distribution of RSGs, while the YHG HR 5171A has been shown to be an interacting binary (Chesneau et al. 2014). Regarding the RSGs in Wd1, the ionised nebula surrounding W26 (Wright et al. 2014) and the resolved circumstellar shells detected by JWST/MIRI around several cool supergiants (Guarcello et al. 2025) could be due to episodic high mass-loss, but may also point to binary interaction. Therefore, we did not attempt to reconcile the YSG-to-RSG ratio with single-star evolutionary models and, instead, we note that the HRD positions of all cool supergiants are consistent with the −5-6.3 Myr age anchored by the main sequence turn-off.
Adopted parameters and bolometric luminosities for the cool supergiants.
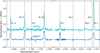 |
Fig. 6 Normalised H- and K-band spectra of the two Be stars identified in our sample, offset vertically for clarity. Object IDs are labelled above the H-band spectra. The spectra exhibit the hydrogen emission lines (Br γ and Br 10-12) and He I and Mg II transitions, typical of Be stars. |
5.2 Be stars
An interesting outcome of this spectroscopic survey is the detection of two objects with emission lines, namely, G2051 and G4877 (see Fig. 6). G2051 and G4877 can be identified with Gaia DR3 5940199912246646656 and 5940106007092363648, respectively. Both objects have astrometric data compatible (within very large errors) with cluster membership, although G2051 has (BP-RP)=3.8, somewhat bluer than the majority of members.
There is a third Be star reported in the field, W1004 (Clark et al. 2020). This object was cross-identified with Gaia DR3 5940106281970191104, a G = 18.5 star with no astrometric or colour information, by Negueruela et al. (2022). However, it is blended with Gaia DR3 5940106277666874752, a much brighter (G = 16.3) star only 0″.7 away. The Gaia astrometric and photometric data are inconclusive due to the high RUWE (≈ 3.7) and do not allow us to confirm cluster membership. Although Clark et al. (2020) noted that its interstellar features are typical of Wd1 members, a foreground nature cannot be excluded. Therefore, we do not include W1004 in the following discussion.
Be stars are quite numerous in massive clusters of older ages (e.g. McSwain & Gies 2005). There is little consensus about the cluster age at which the Be fraction is higher, but the number of Be stars around the turn-off can be very high in clusters with ages around 15 Myr, such as NGC 7419 (Marco & Negueruela 2013). Significant numbers of Be stars around the turn-off are found in NGC 6871, which is about 10 Myr or slightly younger (Negueruela 2004). The presence of Be stars decreases in clusters of ages similar to Wd1, such as M 29 (NGC 6913) or NGC 6231 (Negueruela 2004; McSwain & Gies 2005). The detection of only two Be stars in our whole sample seems, therefore, consistent with our age estimate for the cluster. The Be stars in NGC 6913, NGC 6231 and Wd1 are the youngest Be stars known, and their position within the HRD of their respective clusters may shed light on their formation mechanism. Unfortunately, we cannot derive astrophysical parameters from the observations presented here, as emission lines contaminate many of the diagnostic lines.
6 Conclusions
The NIR spectroscopic detection of the main sequence in Wd1 closes the long-standing uncertainty caused by the cluster’s heavy optical extinction. We identified −50 faint O9-B1 IIIV members and located the turn-off at Teff ≃ 30000 K and L* ≃ 1 × 10⁵ L⊙. We showed that enriched metallicity Geneva isochrones with ages between 5 and 6.3 Myr can reproduce the entire HRD when scaled to  kpc with the Hosek et al. (2018) extinction law, yielding an age of 5.5 ± 1.0 Myr.
Wd1 emerges as a coeval, young, massive system in agreement with the −5-6 Myr ages previously inferred from its most massive evolved stars, now confirmed by direct observation of its previously hidden unevolved members. Within our sensitivity and resolution limits, we did not detect any stellar population consistent with a ~10 Myr age or extended star formation history. Adopting homogeneous, NIR-based luminosity estimates for the cool supergiants, with line of sight extinctions and bolometric corrections appropriate for their spectral types, brings both the YSG+YHG and RSG populations into agreement with a −56.3 Myr cluster age. This supports a single, coeval burst of star formation in Wd1, without the need to invoke an older stellar population.
The HRD solution remains stable against reasonable shifts in distance, metallicity, and extinction curve. None of these variations alter the derived age by more than −1 Myr (see Appendix C). The tight −5.5 Myr age constraint provided here offers a crucial anchor for ongoing large-scale programmes (e.g. Guarcello et al. 2025) that aim to characterise Wd1 across its entire mass spectrum.
Finally, our multi-epoch spectroscopic observations reveal a remarkably high incidence of radial-velocity variability among the unevolved members of Wd1. We identified −65% candidate spectroscopic binaries among the OB stars with multi-epoch coverage, a fraction greater than previously reported by the optical FLAMES data (Ritchie et al. 2022). The high incidence of radial-velocity variability among main sequence stars, together with the presence of evolved objects, underscores Wdl’s value as a natural laboratory for studying binary interaction in massive star evolution.
Data availability
VLT data are available in the ESO Science Archive Facility (http://archive.eso.org/wdb/wdb/adp/phase3_main/form).
Acknowledgements
We thank our anonymous referee for careful and constructive comments. R. Castellanos gratefully acknowledges the financial support through the PRE2020-096167 grant provided by the Spanish MCIN. R. Castellanos, F. Najarro, M. Garcia, and L.R. Patrick gratefully acknowledge support by grant PID2022-137779OB-C41, and M. Garcia and L.R. Patrick further acknowledge grant PID2022-140483NB-C22, funded by the Spanish Ministry of Science, Innovation and Universities/State Agency of Research MICIU/AEI/10.13039/501100011033 and by “ERDF A way of making Europe”. F. Najarro and M. Garcia also acknowledge grant MAD4SPACE, TEC-2024/TEC-182 from Comunidad de Madrid (Spain). T. Shenar acknowledges support from the Israel Science Foundation (ISF) under grant number 0603225041 and from the European Research Council (ERC) under the European Union’s Horizon 2020 research and innovation program (grant agreement 101164755/METAL). I. Negueruela is partially supported by the MCIU and AEI under grants PID2021-122397NB-C22 and PID2024-159329NB-C22. M.G. Guarcello acknowledges the INAF grant 1.05.12.05.03. Based on observations collected at the European Southern Observatory under ESO programmes 109.233D.001 and data obtained from the ESO Science Archive Facility with DOI: https://doi.org/10.18727/archive/71.
References
- Aghakhanloo, M., Murphy, J. W., Smith, N., et al. 2021, RNAAS, 5, 14 [Google Scholar]
- Anastasopoulou, K., Guarcello, M. G., Flaccomio, E., et al. 2024, A&A, 690, A25 [NASA ADS] [CrossRef] [EDP Sciences] [Google Scholar]
- Andersen, M., Gennaro, M., Brandner, W., et al. 2017, A&A, 602, A22 [NASA ADS] [CrossRef] [EDP Sciences] [Google Scholar]
- Arévalo, A. d. L. E. R. 2018, Master’s thesis, Instituto de Astronomia, Geofísica e Ciências Atmosféricas, University of São Paulo [Google Scholar]
- Beasor, E. R., Davies, B., Smith, N., Gehrz, R. D., & Figer, D. F. 2021, ApJ, 912, 16 [NASA ADS] [CrossRef] [Google Scholar]
- Beasor, E. R., Smith, N., & Andrews, J. E. 2023, ApJ, 952, 113 [NASA ADS] [CrossRef] [Google Scholar]
- Bodensteiner, J., Sana, H., Wang, C., et al. 2021, A&A, 652, A70 [NASA ADS] [CrossRef] [EDP Sciences] [Google Scholar]
- Brandner, W., Clark, J. S., Stolte, A., et al. 2008, A&A, 478, 137 [NASA ADS] [CrossRef] [EDP Sciences] [Google Scholar]
- Cardelli, J. A., Clayton, G. C., & Mathis, J. S. 1989, ApJ, 345, 245 [Google Scholar]
- Chen, Y., Girardi, L., Fu, X., et al. 2019, A&A, 632, A105 [EDP Sciences] [Google Scholar]
- Chesneau, O., Meilland, A., Chapellier, E., et al. 2014, A&A, 563, A71 [NASA ADS] [CrossRef] [EDP Sciences] [Google Scholar]
- Clark, J. S., Negueruela, I., Crowther, P. A., & Goodwin, S. P. 2005, A&A, 434, 949 [NASA ADS] [CrossRef] [EDP Sciences] [Google Scholar]
- Clark, J. S., Ritchie, B. W., Negueruela, I., et al. 2011, A&A, 531, A28 [NASA ADS] [CrossRef] [EDP Sciences] [Google Scholar]
- Clark, J. S., Ritchie, B. W., Najarro, F., Langer, N., & Negueruela, I. 2014, A&A, 565, A90 [NASA ADS] [CrossRef] [EDP Sciences] [Google Scholar]
- Clark, J. S., Najarro, F., Negueruela, I., et al. 2019, A&A, 623, A83 [NASA ADS] [CrossRef] [EDP Sciences] [Google Scholar]
- Clark, J. S., Ritchie, B. W., & Negueruela, I. 2020, A&A, 635, A187 [EDP Sciences] [Google Scholar]
- Crowther, P. A., Hadfield, L. J., Clark, J. S., Negueruela, I., & Vacca, W. D. 2006, MNRAS, 372, 1407 [Google Scholar]
- Damineli, A., Almeida, L. A., Blum, R. D., et al. 2016, MNRAS, 463, 2653 [NASA ADS] [CrossRef] [Google Scholar]
- Davies, B., & Beasor, E. R. 2019, MNRAS, 486, L10 [NASA ADS] [CrossRef] [Google Scholar]
- Davies, R. I., Agudo Berbel, A., Wiezorrek, E., et al. 2013, A&A, 558, A56 [NASA ADS] [CrossRef] [EDP Sciences] [Google Scholar]
- Ekström, S., Georgy, C., Eggenberger, P., et al. 2012, A&A, 537, A146 [Google Scholar]
- Fenech, D. M., Clark, J. S., Prinja, R. K., et al. 2018, A&A, 617, A137 [NASA ADS] [CrossRef] [EDP Sciences] [Google Scholar]
- Flower, P. J. 1996, ApJ, 469, 355 [NASA ADS] [CrossRef] [Google Scholar]
- Freudling, W., Romaniello, M., Bramich, D. M., et al. 2013, A&A, 559, A96 [NASA ADS] [CrossRef] [EDP Sciences] [Google Scholar]
- Gaia Collaboration (Brown, A. G. A., et al.) 2021, A&A, 649, A1 [NASA ADS] [CrossRef] [EDP Sciences] [Google Scholar]
- Gennaro, M., Brandner, W., Stolte, A., & Henning, T. 2011, MNRAS, 412, 2469 [NASA ADS] [CrossRef] [Google Scholar]
- Guarcello, M. G., Flaccomio, E., Albacete-Colombo, J. F., et al. 2024, A&A, 682, A49 [NASA ADS] [CrossRef] [EDP Sciences] [Google Scholar]
- Guarcello, M. G., Almendros-Abad, V., Lovell, J. B., et al. 2025, A&A, 693, A120 [NASA ADS] [CrossRef] [EDP Sciences] [Google Scholar]
- Hanson, M. M., Kudritzki, R. P., Kenworthy, M. A., Puls, J., & Tokunaga, A. T. 2005, ApJS, 161, 154 [NASA ADS] [CrossRef] [Google Scholar]
- Hillier, D. J., & Miller, D. L. 1998, ApJ, 496, 407 [NASA ADS] [CrossRef] [Google Scholar]
- Hosek, Jr., M. W., Lu, J. R., Anderson, J., et al. 2018, ApJ, 855, 13 [Google Scholar]
- Howarth, I. D. 1983, MNRAS, 203, 301 [NASA ADS] [CrossRef] [Google Scholar]
- Humphreys, R. M., & McElroy, D. B. 1984, ApJ, 284, 565 [NASA ADS] [CrossRef] [Google Scholar]
- Koumpia, E., & Bonanos, A. Z. 2012, A&A, 547, A30 [NASA ADS] [CrossRef] [EDP Sciences] [Google Scholar]
- Levesque, E. M., Massey, P., Olsen, K. A. G., et al. 2005, in American Astronomical Society Meeting Abstracts, 207, 182.13 [Google Scholar]
- Lim, B., Chun, M.-Y., Sung, H., et al. 2013, AJ, 145, 46 [NASA ADS] [CrossRef] [Google Scholar]
- Marco, A., & Negueruela, I. 2013, A&A, 552, A92 [NASA ADS] [CrossRef] [EDP Sciences] [Google Scholar]
- McSwain, M. V., & Gies, D. R. 2005, ApJ, 622, 1052 [NASA ADS] [CrossRef] [Google Scholar]
- Muno, M. P., Clark, J. S., Crowther, P. A., et al. 2006, ApJ, 636, L41 [NASA ADS] [CrossRef] [Google Scholar]
- Navarete, F., Damineli, A., Ramirez, A. E., Rocha, D. F., & Almeida, L. A. 2022, MNRAS, 516, 1289 [NASA ADS] [CrossRef] [Google Scholar]
- Negueruela, I. 2004, Astron. Nachr., 325, 380 [Google Scholar]
- Negueruela, I., Clark, J. S., & Ritchie, B. W. 2010, A&A, 516, A78 [NASA ADS] [CrossRef] [EDP Sciences] [Google Scholar]
- Negueruela, I., Alfaro, E. J., Dorda, R., et al. 2022, A&A, 664, A146 [NASA ADS] [CrossRef] [EDP Sciences] [Google Scholar]
- Negueruela, I., Simón-Díaz, S., de Burgos, A., Casasbuenas, A., & Beck, P. G. 2024, A&A, 690, A176 [NASA ADS] [CrossRef] [EDP Sciences] [Google Scholar]
- Ritchie, B. W., Clark, J. S., Negueruela, I., & Najarro, F. 2009, A&A, 507, 1597 [NASA ADS] [CrossRef] [EDP Sciences] [Google Scholar]
- Ritchie, B. W., Clark, J. S., Negueruela, I., & Langer, N. 2010, A&A, 520, A48 [NASA ADS] [CrossRef] [EDP Sciences] [Google Scholar]
- Ritchie, B. W., Clark, J. S., Negueruela, I., & Najarro, F. 2022, A&A, 660, A89 [NASA ADS] [CrossRef] [EDP Sciences] [Google Scholar]
- Rosslowe, C. 2015, PhD thesis, University of Sheffield [Google Scholar]
- Sana, H., de Koter, A., de Mink, S. E., et al. 2013, A&A, 550, A107 [NASA ADS] [CrossRef] [EDP Sciences] [Google Scholar]
- Sharples, R., Bender, R., Agudo Berbel, A., et al. 2013, The Messenger, 151, 21 [NASA ADS] [Google Scholar]
- Smette, A., Sana, H., Noll, S., et al. 2015, A&A, 576, A77 [NASA ADS] [CrossRef] [EDP Sciences] [Google Scholar]
- Wang, C., Patrick, L., Schootemeijer, A., et al. 2025, ApJ, 981, L16 [Google Scholar]
- Westerlund, B. 1961, Astron. J., 66, 57 [Google Scholar]
- Wright, N. J., Wesson, R., Drew, J. E., et al. 2014, MNRAS, 437, L1 [NASA ADS] [CrossRef] [Google Scholar]
- Yusof, N., Hirschi, R., Eggenberger, P., et al. 2022, MNRAS, 511, 2814 [NASA ADS] [CrossRef] [Google Scholar]
Adopting a more conservative threshold of ∆RV > 25 km s−1, as in Ritchie et al. (2022), would yield a detection fraction of 60.6%.
We note that Rosslowe (2015) used a different extinction law (based on Howarth 1983 and Cardelli et al. 1989), which may yield higher luminosities for the WR sample.
The YBC database (Chen et al. 2019) provides bolometric corrections for a wide range of photometric systems.
Appendix A Stellar parameters of the analysed sample
Stellar parameters for the analysed sample.
Appendix B Example of CMFGEN spectral fit
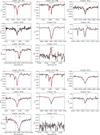 |
Fig. B.1 CMFGEN model fits (red) to KMOS spectra (black) in the J, H, and K bands. Top: star W1051 (O9 III) — Teff = 30.5 kK, log g = 3.45. Bottom: star G787 (O9-O9.5 V) — Teff = 28 kK, log g = 4.15. Key hydrogen and helium diagnostic lines are indicated in each panel. |
Appendix C Impact of adopted parameters on the HRD
In this section we examine how sensitive our results are to the adopted distance, extinction law, and stellar rotation and metal-licity of the evolutionary models. In each case, we recomputed the stellar luminosity or re-evaluated the HRD under alternative assumptions in order to ascertain the potential change in inferred age.
Appendix C.1 Effect of adopted distance
The adopted distance affects the luminosities of all stars, as illustrated in Fig. C.1. A significantly shorter distance of ~2.8 kpc, as proposed by Aghakhanloo et al. (2021), shifts all stars’ luminosity downward by approximately 0.3 dex. In this scenario, most main sequence stars would have lower luminosity and effective temperature than predicted even by the youngest available isochrones, making it impossible to reconcile their positions with any standard evolutionary track. Similarly, the main sequence region would lie in a regime inconsistent with single-star models, and the evolved supergiants would appear anomalously faint. Such a short distance would also imply systematically lower stellar mass-loss rates inferred from radio and sub-mm diagnostics (by a factor of ~0.4), as shown by the ALMA study of Wd1 supergiants by Fenech et al. (2018). We therefore conclude that a distance as low as ~3 kpc cannot accommodate either the observed HRD or the derived wind properties of Wd1 members.
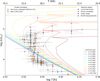 |
Fig. C.1 Westerlund 1’s HRD, using a hypothetical distance of 2.8 kpc. Lowering the distance to 2.8 kpc decreases stellar luminosities by ∼0.3 dex, placing many of the main sequence stars below the youngest available isochrones (Yusof et al. 2022). |
Appendix C.2 Analysis with evolutionary isochrones with different metallicity
We tested Geneva stellar evolution models at solar metallicity (Z = 0.014, Ekström et al. (2012), as shown in Fig. C.2. At a given effective temperature the solar-metallicity isochrones are observed to be 0.1-0.12 dex brighter in log L* than the Z = 0.020 tracks. In terms of cluster age the impact is minor: switching from Z = 0.020 to Z = 0.014 alters the best-fit turn-off age by less than 0.5 Myr, although we note that in this scenario the main sequence stars would yield discrepant higher ages. We conclude that reasonable uncertainties in metallicity do not significantly affect the derived age.
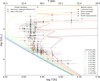 |
Fig. C.2 HRD comparing the observed stars with Geneva evolutionary tracks at solar metallicity (Z = 0.014; vini = 0, Ekström et al. 2012). |
Appendix C.3 Analysis with evolutionary isochrones with different initial rotational velocity
Figure C.3 compares the location of the sample stars in the HRD against Z = 0.020 (Yusof et al. 2022) isochrones computed with initial angular velocity of vrot = 0.4 vcrit. Rotation increases the main sequence lifetime through enhanced internal mixing, so the rotating isochrone reaches the observed turn-off temperature after additional ≃ 0.8 Myr. The turn-off would be consistent with a slightly older 6.3-7.9 age, although in this case the main sequence members would point to a younger value. Moreover, we find no evidence for stars rotating near the critical velocity. Consequently, the larger ages implied by near-critical rotational tracks are disfavoured.
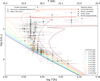 |
Fig. C.3 HRD showing Geneva tracks (Z = 0.020, (Yusof et al. 2022) for vini = 0.4 vcrit rotating models. |
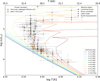 |
Fig. C.4 HRD with stellar luminosities computed using the extinction law of Damineli et al. (2016). The non-rotating Geneva isochrones (Z = 0.020; Yusof et al. 2022) are shown for comparison. |
Appendix C.4 Effect of adopting a different foreground extinction law
We adopted the Hosek et al. (2018) extinction curve to calculate stellar luminosities, which was derived for environments like Wd1 and the Galactic Centre. An alternative approach is to consider the steeper optical-IR law from Damineli et al. (2016). Using the Damineli law would make our stars slightly more luminous by up to ∆ log L ~ 0.05 dex on average (Figure C.4). We found that this negligibly impacts the derived cluster age. A uniform increment of 0.05 dex in L* would translate into a slightly older age for main sequence stars, while the turn off and evolved stars would point to younger ages. We conclude that using a different extinction law does not alter our results significantly.
All Tables
All Figures
|
Fig. 1 Comparison of the final, telluric-corrected science spectra obtained with the two considered methods for telluric correction, one based on a standard star (blue) and the other using Molecfit (orange). Two wavelength intervals strongly affected by telluric absorption are shown: top, 2.04-2.075 μm around the He I line at 2.058 μm; bottom, 2.41-2.45 μm around Si IV at 2.4265 μm. |
| In the text | |
|
Fig. 2 Normalised J - and H-band spectra of four newly classified OB members of Westerlund 1, offset vertically for clarity. Object IDs and adopted spectral types are indicated on the left. Principal diagnostic lines used for the spectral classification include Pa δ, Pa γ, He I 1.083 μm, He I 1.092 μm, He I 1.278 μm, Br 10-12, He II 1.692 μm, and He I 1.700 μm. |
| In the text | |
|
Fig. 3 Zoom over the spectra used for the radial-velocity measurement of Wd1-1048. Coloured lines correspond to epochs as indicated in the legend. Left: DIB 1.527 μm absorption in the five epochs, adopted as wavelength reference (vertical red dashed line marks the rest frame wavelength). Right: He I 1.70 μm line in the five epochs after realigning the spectra. Wd1-1048 is a known RV variable and possible eclipsing binary (Ritchie et al. 2022). |
| In the text | |
|
Fig. 4 HRD for the observed sample in Wd1. The colour of the symbols encodes the binary status based on RV measurements: confirmed binaries from Ritchie et al. (2022, red), candidate binaries identified in this work (orange), likely single stars (blue), and stars without RV measurements (grey). The shape of the symbols indicates whether the star had been analysed previously by Ritchie et al. (2022, triangles), while circles mark stars analysed for the first time in this work. Z = 0.02 isochrones (Yusof et al. 2022) for ages log t [yr] = 6.0-7.0 are overplotted (coloured curves). |
| In the text | |
|
Fig. 5 HRD of Westerlund 1 that combines the ~110 OB stars analysed in this work (black circles) with selected evolved members from the literature. Representative error bars for the blue stars in this work are provided at the bottom. Blue triangles denote WR stars2 (Rosslowe 2015), while orange squares mark yellow and red supergiants (Beasor et al. 2021). Black squares show the YSG and RSG luminosities recalculated in this work (Sect. 5.1). Grey dashed lines connect each star to its value given in Beasor et al. (2021), illustrating the offset between both approaches. Green diamonds correspond to the bluestraggler hypergiants Wd1-27 and Wd1-30a (Clark et al. 2019). The luminous-blue-variable Wd1-243 is shown as a yellow cross (Ritchie et al. 2009). Finally, the supergiant Wd1-5 appears as a magenta inverted triangle (Clark et al. 2014). The region where YHGs would lie, following the luminosities proposed by Clark et al. (2020), is indicated by an empty black square. All literature luminosities have been rescaled to the distance adopted here of |
| In the text | |
|
Fig. 6 Normalised H- and K-band spectra of the two Be stars identified in our sample, offset vertically for clarity. Object IDs are labelled above the H-band spectra. The spectra exhibit the hydrogen emission lines (Br γ and Br 10-12) and He I and Mg II transitions, typical of Be stars. |
| In the text | |
|
Fig. B.1 CMFGEN model fits (red) to KMOS spectra (black) in the J, H, and K bands. Top: star W1051 (O9 III) — Teff = 30.5 kK, log g = 3.45. Bottom: star G787 (O9-O9.5 V) — Teff = 28 kK, log g = 4.15. Key hydrogen and helium diagnostic lines are indicated in each panel. |
| In the text | |
|
Fig. C.1 Westerlund 1’s HRD, using a hypothetical distance of 2.8 kpc. Lowering the distance to 2.8 kpc decreases stellar luminosities by ∼0.3 dex, placing many of the main sequence stars below the youngest available isochrones (Yusof et al. 2022). |
| In the text | |
|
Fig. C.2 HRD comparing the observed stars with Geneva evolutionary tracks at solar metallicity (Z = 0.014; vini = 0, Ekström et al. 2012). |
| In the text | |
|
Fig. C.3 HRD showing Geneva tracks (Z = 0.020, (Yusof et al. 2022) for vini = 0.4 vcrit rotating models. |
| In the text | |
|
Fig. C.4 HRD with stellar luminosities computed using the extinction law of Damineli et al. (2016). The non-rotating Geneva isochrones (Z = 0.020; Yusof et al. 2022) are shown for comparison. |
| In the text | |
Current usage metrics show cumulative count of Article Views (full-text article views including HTML views, PDF and ePub downloads, according to the available data) and Abstracts Views on Vision4Press platform.
Data correspond to usage on the plateform after 2015. The current usage metrics is available 48-96 hours after online publication and is updated daily on week days.
Initial download of the metrics may take a while.