Fig. 5
Download original image
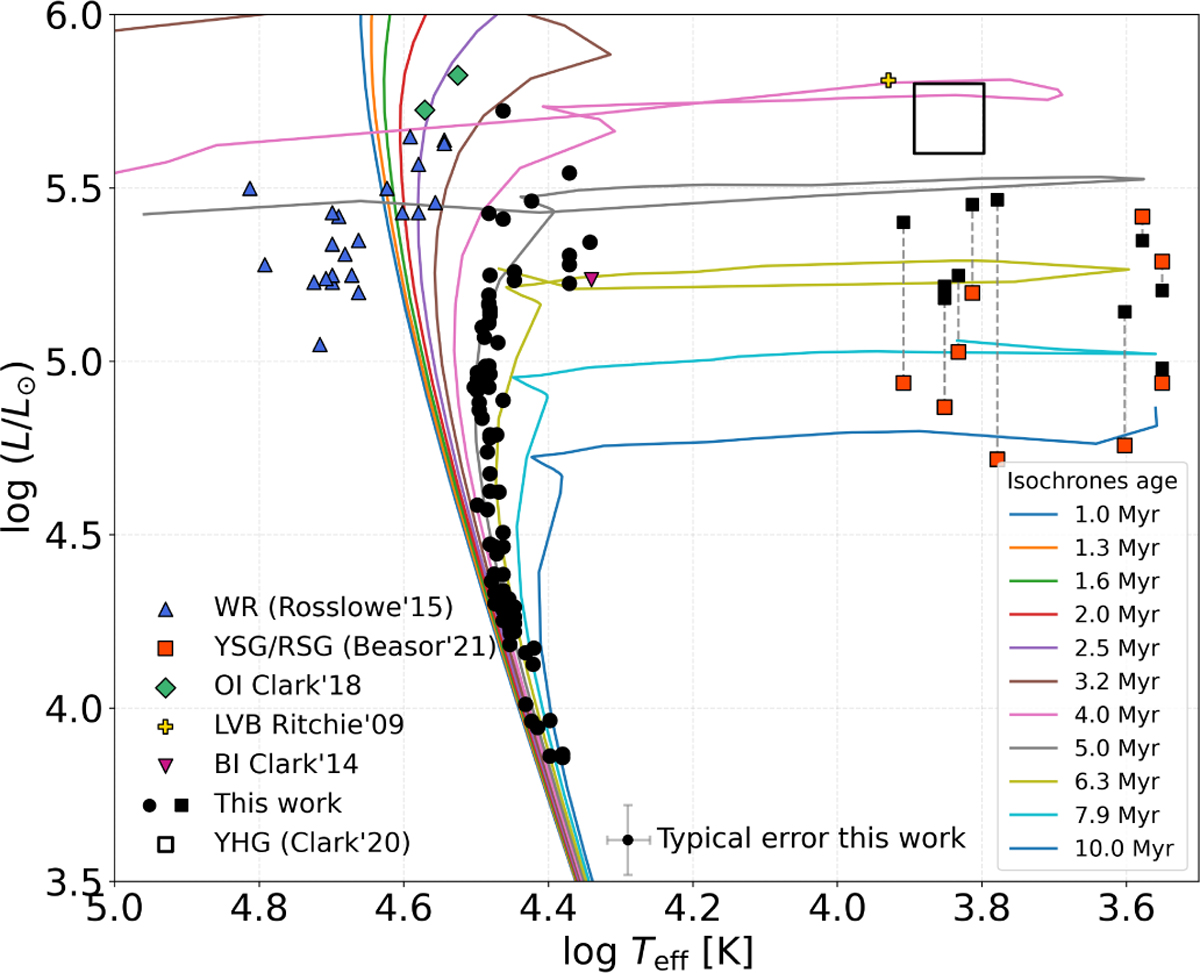
HRD of Westerlund 1 that combines the ~110 OB stars analysed in this work (black circles) with selected evolved members from the literature. Representative error bars for the blue stars in this work are provided at the bottom. Blue triangles denote WR stars2 (Rosslowe 2015), while orange squares mark yellow and red supergiants (Beasor et al. 2021). Black squares show the YSG and RSG luminosities recalculated in this work (Sect. 5.1). Grey dashed lines connect each star to its value given in Beasor et al. (2021), illustrating the offset between both approaches. Green diamonds correspond to the bluestraggler hypergiants Wd1-27 and Wd1-30a (Clark et al. 2019). The luminous-blue-variable Wd1-243 is shown as a yellow cross (Ritchie et al. 2009). Finally, the supergiant Wd1-5 appears as a magenta inverted triangle (Clark et al. 2014). The region where YHGs would lie, following the luminosities proposed by Clark et al. (2020), is indicated by an empty black square. All literature luminosities have been rescaled to the distance adopted here of ![]() kpc. Coloured curves are Z = 0.02 isochrones (Yusof et al. 2022) for ages between 1 and 10 Myr, as indicated in the legend.
kpc. Coloured curves are Z = 0.02 isochrones (Yusof et al. 2022) for ages between 1 and 10 Myr, as indicated in the legend.
Current usage metrics show cumulative count of Article Views (full-text article views including HTML views, PDF and ePub downloads, according to the available data) and Abstracts Views on Vision4Press platform.
Data correspond to usage on the plateform after 2015. The current usage metrics is available 48-96 hours after online publication and is updated daily on week days.
Initial download of the metrics may take a while.