Open Access
Fig. 6
Download original image
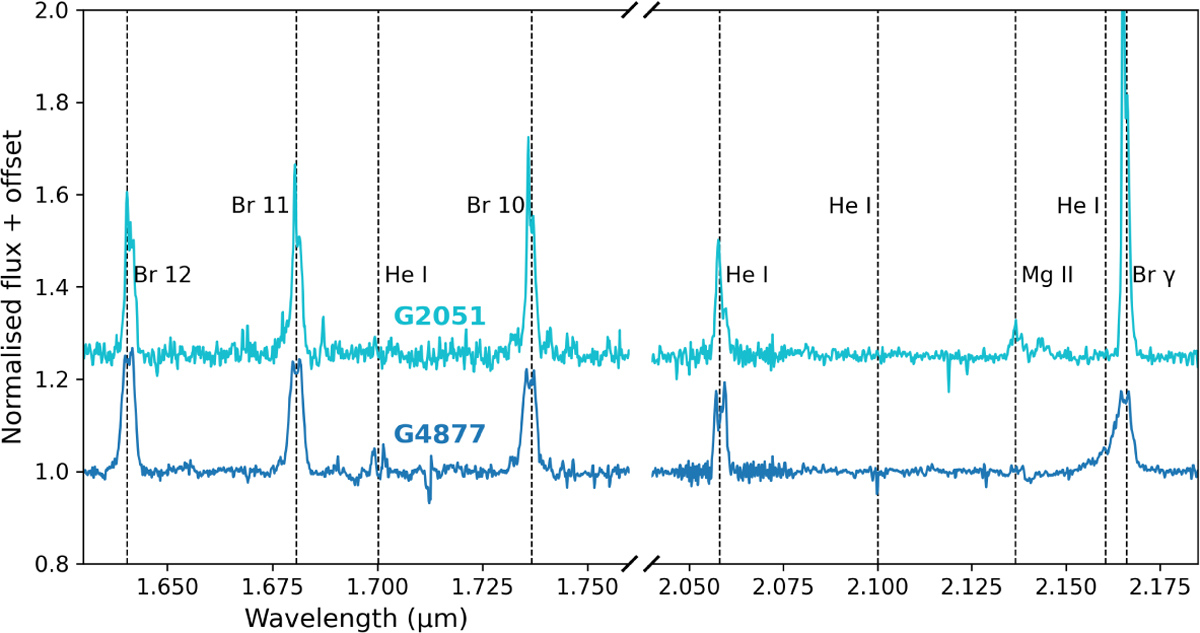
Normalised H- and K-band spectra of the two Be stars identified in our sample, offset vertically for clarity. Object IDs are labelled above the H-band spectra. The spectra exhibit the hydrogen emission lines (Br γ and Br 10-12) and He I and Mg II transitions, typical of Be stars.
Current usage metrics show cumulative count of Article Views (full-text article views including HTML views, PDF and ePub downloads, according to the available data) and Abstracts Views on Vision4Press platform.
Data correspond to usage on the plateform after 2015. The current usage metrics is available 48-96 hours after online publication and is updated daily on week days.
Initial download of the metrics may take a while.