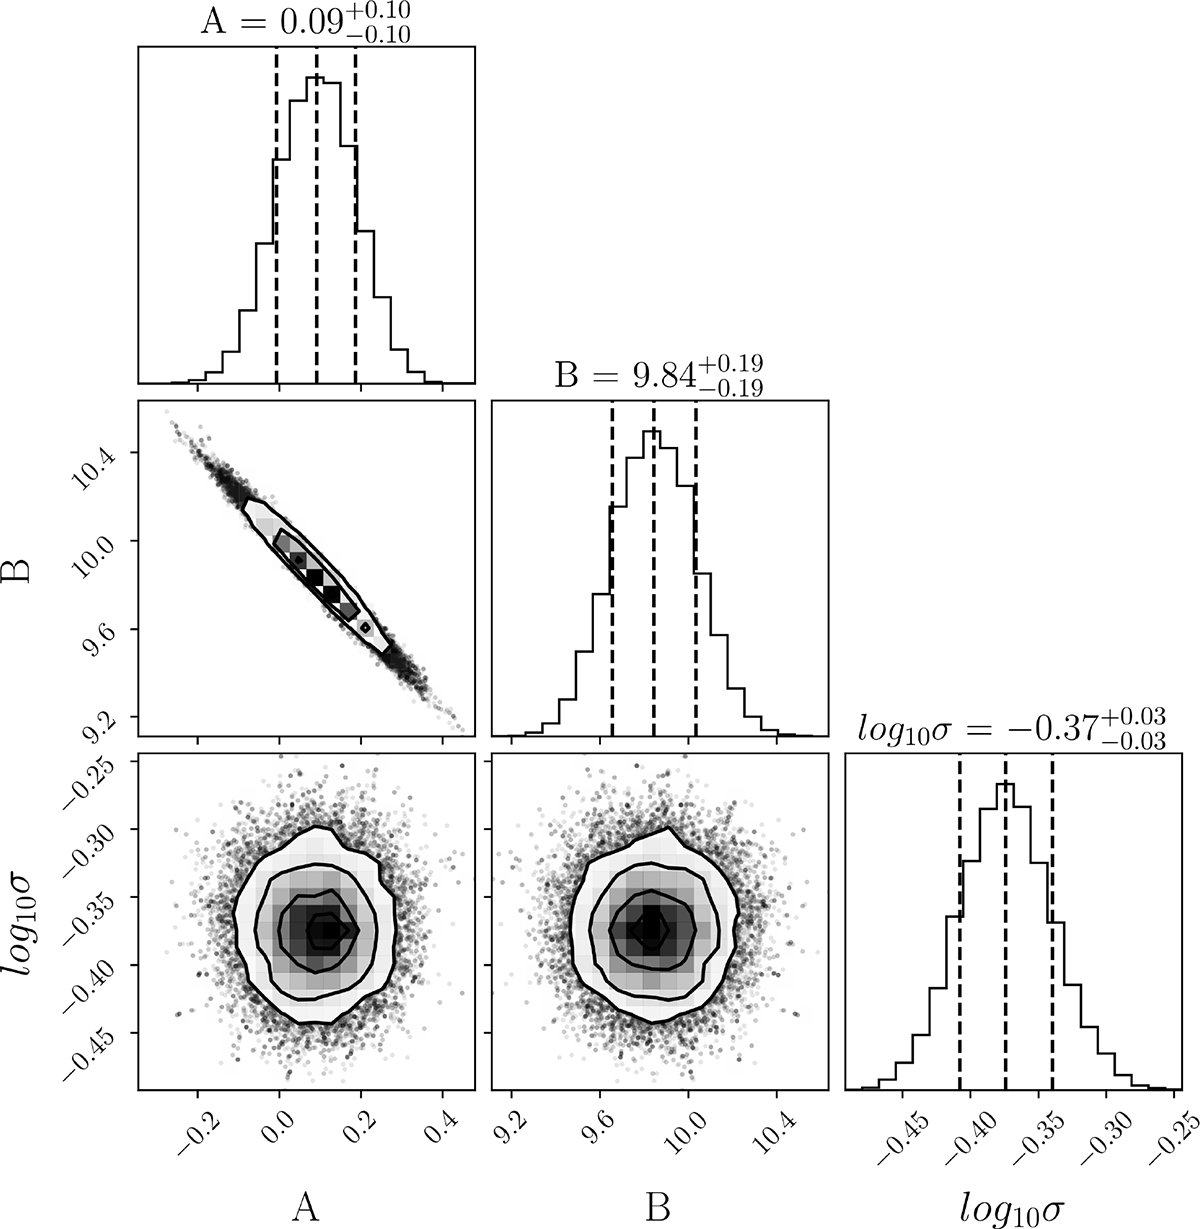
Fig. A.2.
Download original image
Marginalized one-dimensional (diagonal) and two-dimensional (off-diagonal) posterior probability distributions for the model parameters: slope (A), intercept (B), and log-scatter (log10σ). The diagonal histograms show the median (central line) and the 1σ intervals. A strong negative correlation is evident between the slope (A) and the intercept (B).
Current usage metrics show cumulative count of Article Views (full-text article views including HTML views, PDF and ePub downloads, according to the available data) and Abstracts Views on Vision4Press platform.
Data correspond to usage on the plateform after 2015. The current usage metrics is available 48-96 hours after online publication and is updated daily on week days.
Initial download of the metrics may take a while.