Open Access
Fig. B.1.
Download original image
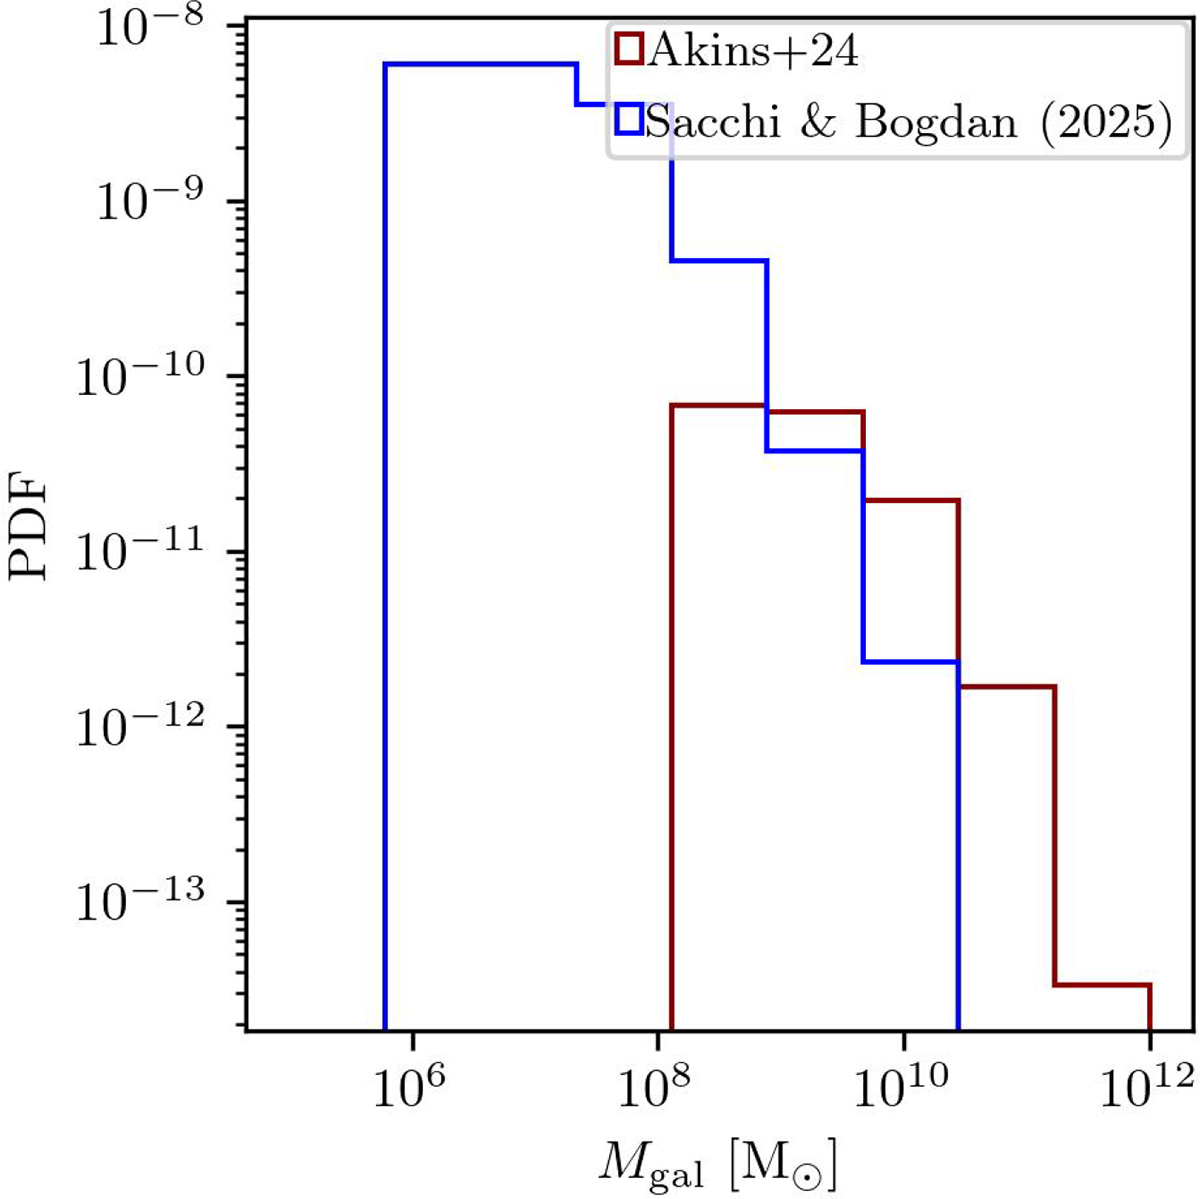
Comparison of the stellar mass distributions between the A+24 sample (red) and the S+25 subsample (blue). While the S+25 sample extends to lower masses, the X-ray stacking signal is dominated by the massive end of the population, justifying the use of structural parameters derived from the A+24 sample.
Current usage metrics show cumulative count of Article Views (full-text article views including HTML views, PDF and ePub downloads, according to the available data) and Abstracts Views on Vision4Press platform.
Data correspond to usage on the plateform after 2015. The current usage metrics is available 48-96 hours after online publication and is updated daily on week days.
Initial download of the metrics may take a while.