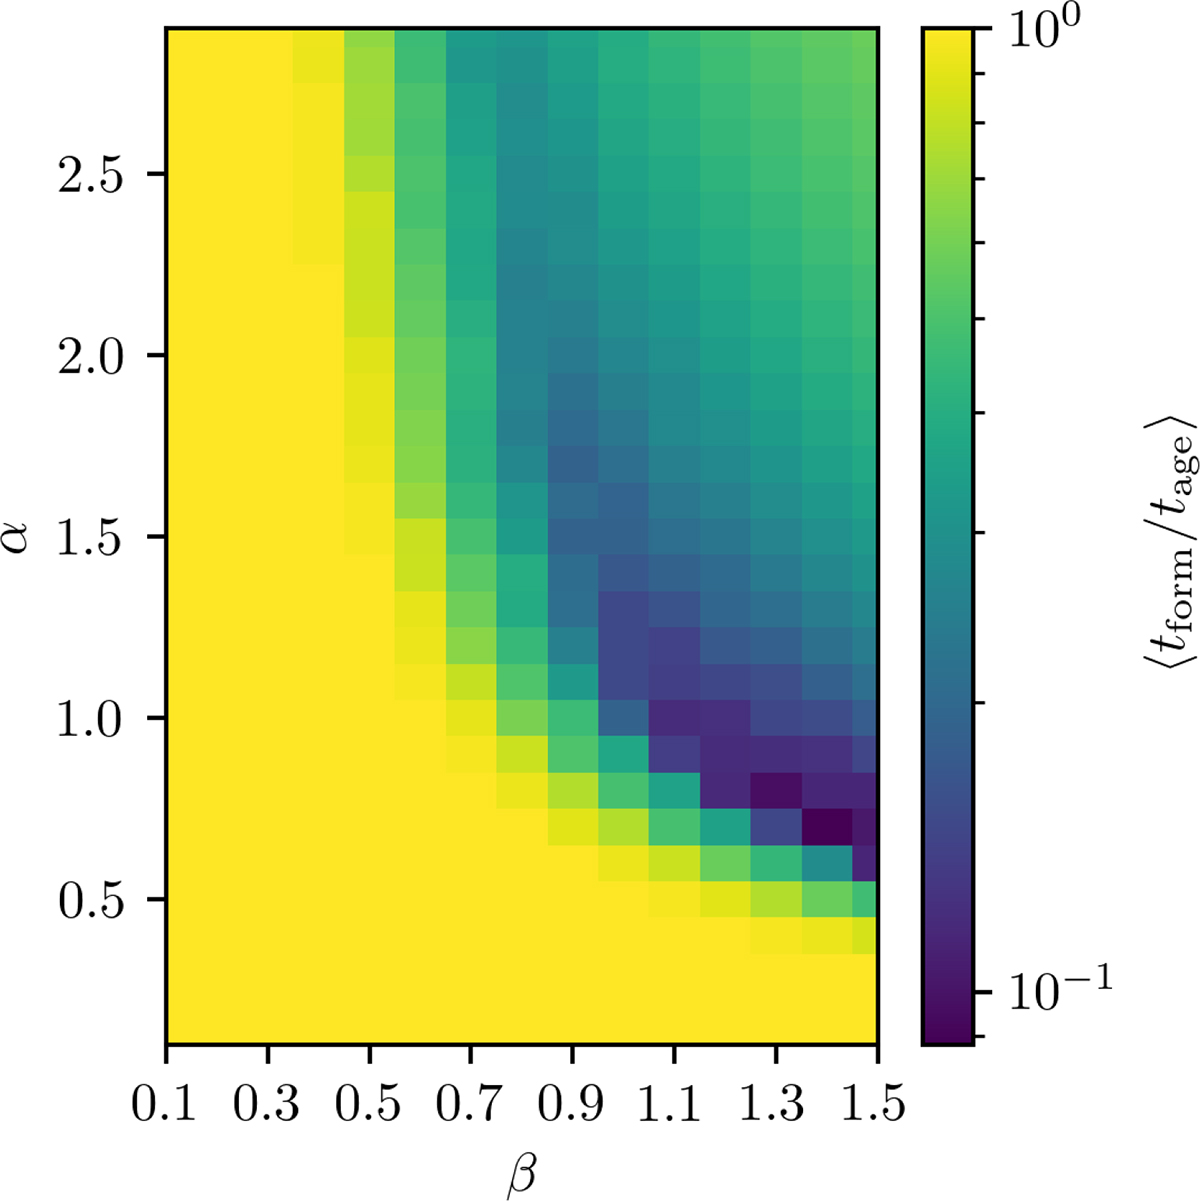
Fig. C.1.
Download original image
Average ratio between the BH formation time (tform) and the total age of the galaxy (tage) for each (α, β) model (see the colorbar). The y-axis shows the star formation parameter α, and the x-axis shows the mass-radius relation exponent β. Dark purple regions indicate very early seed formation (tform ≈ 0.1 tage), while yellow regions indicate very late formation (tform ≈ tage).
Current usage metrics show cumulative count of Article Views (full-text article views including HTML views, PDF and ePub downloads, according to the available data) and Abstracts Views on Vision4Press platform.
Data correspond to usage on the plateform after 2015. The current usage metrics is available 48-96 hours after online publication and is updated daily on week days.
Initial download of the metrics may take a while.