Fig. D.1.
Download original image
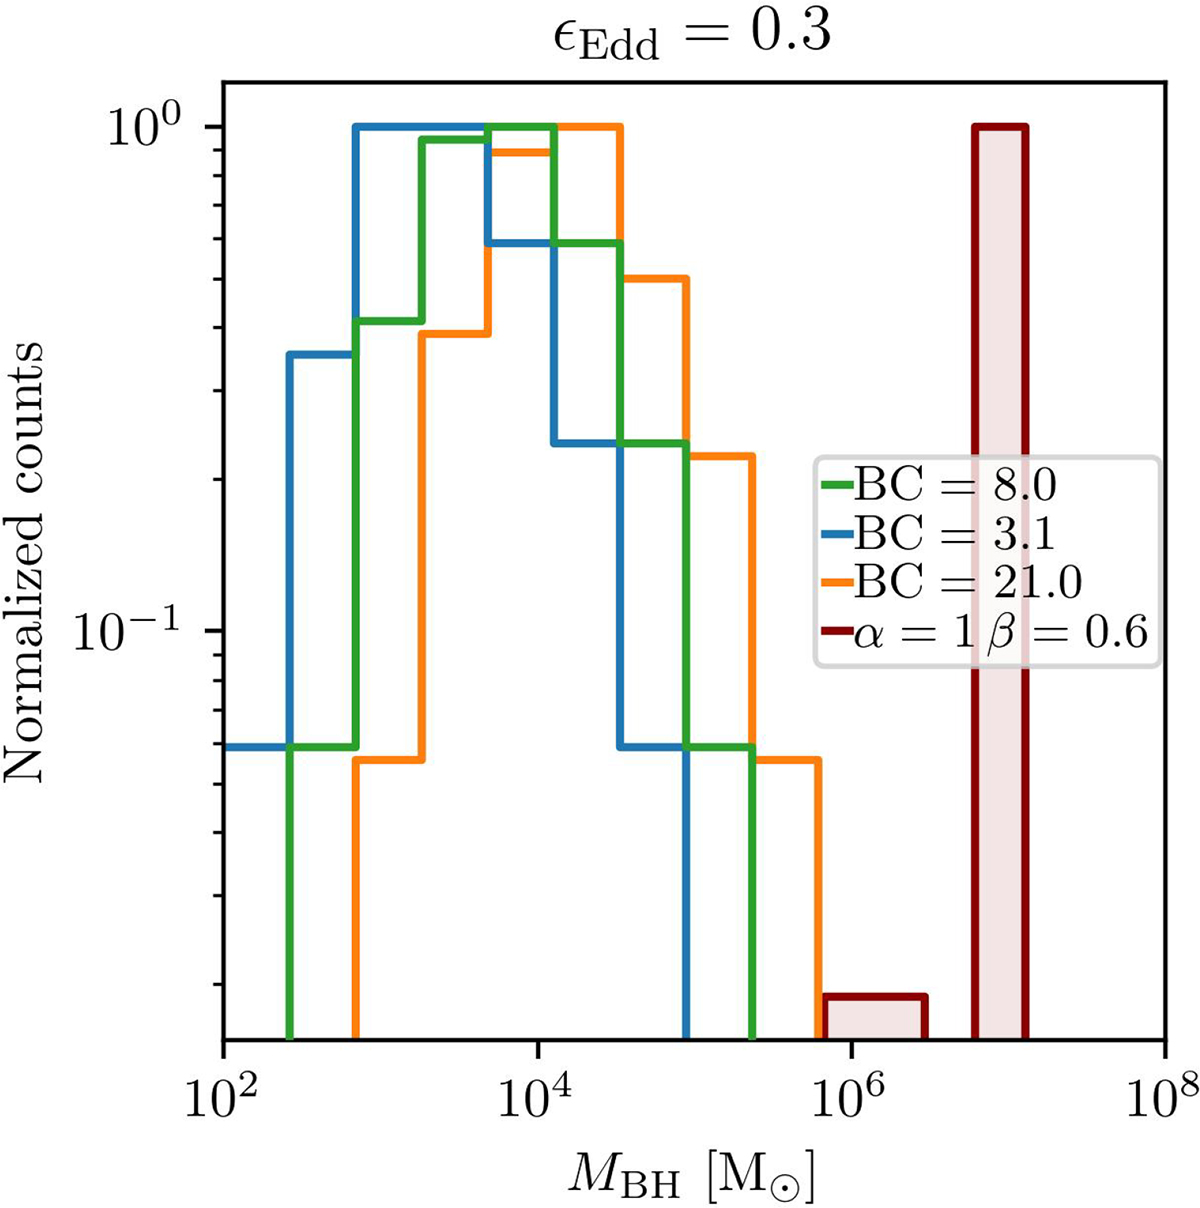
Distribution of BH masses inferred with the luminosities obtained from the mF444W magnitude, compared to our reference model α = 1 and β = 0.6 (filled red histogram). The top panel assumes an Eddington fraction ϵEdd = 10−3. The bottom panel assumes ϵEdd = 10−4. The colored lines show the mass distributions for the standard BC (BC = 8.0, green), the minimum (BC = 3.1, blue), and the maximum (BC = 21.0, orange).
Current usage metrics show cumulative count of Article Views (full-text article views including HTML views, PDF and ePub downloads, according to the available data) and Abstracts Views on Vision4Press platform.
Data correspond to usage on the plateform after 2015. The current usage metrics is available 48-96 hours after online publication and is updated daily on week days.
Initial download of the metrics may take a while.