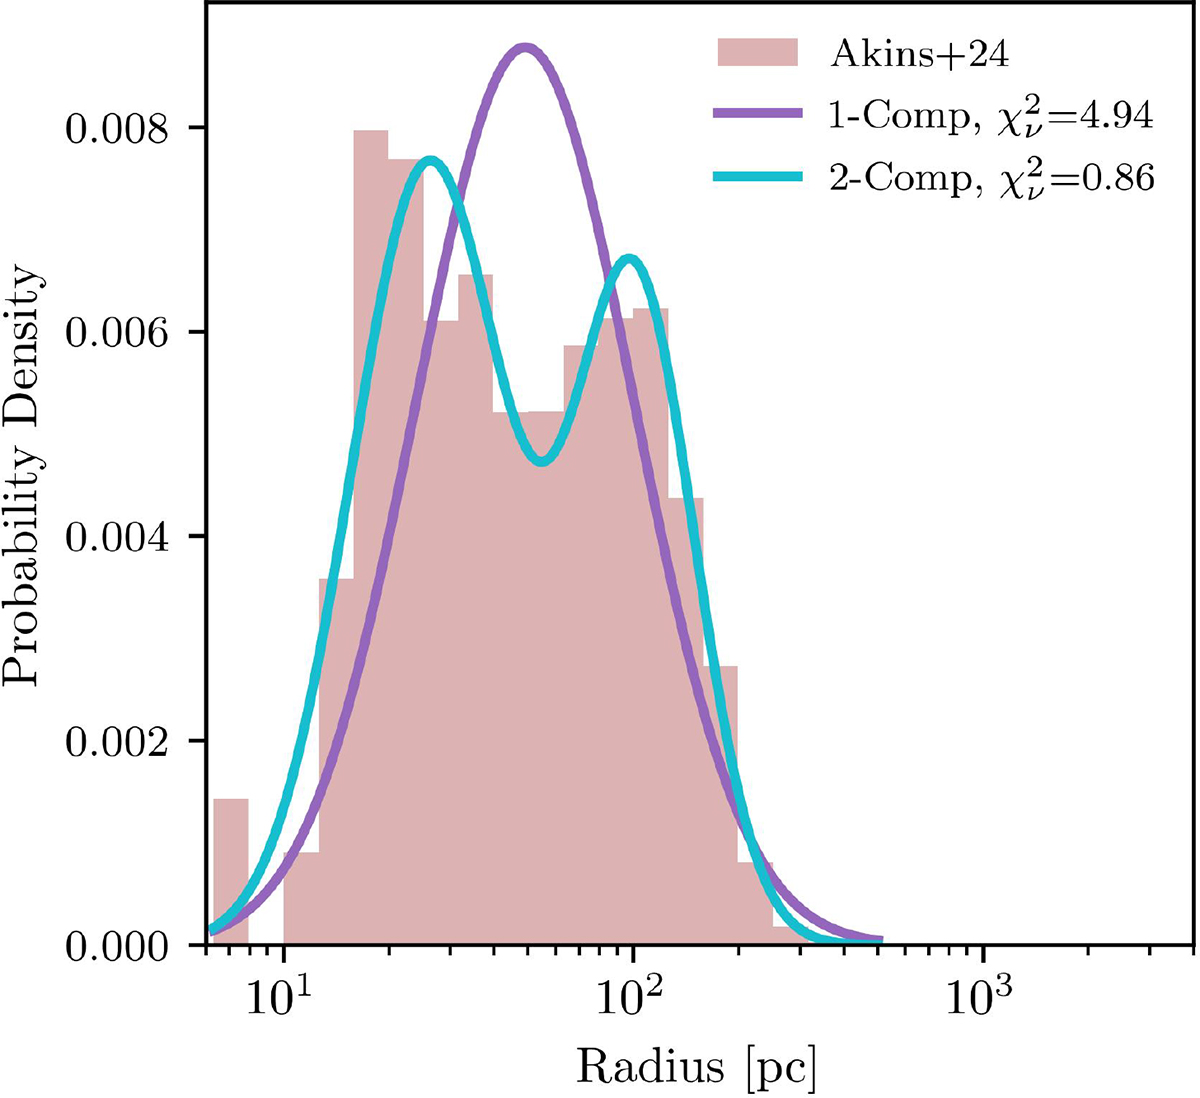
Fig. 2.
Download original image
Probability density distribution of effective radii (Rgal) for the galaxy sample from A+24. The shaded red histogram shows the observed data binned in logarithmic intervals. The solid curves represent the best-fit Gaussian mixture models, assuming a single component (purple) and two components (cyan). We show the reduced chi-squared (χν2) for each model.
Current usage metrics show cumulative count of Article Views (full-text article views including HTML views, PDF and ePub downloads, according to the available data) and Abstracts Views on Vision4Press platform.
Data correspond to usage on the plateform after 2015. The current usage metrics is available 48-96 hours after online publication and is updated daily on week days.
Initial download of the metrics may take a while.