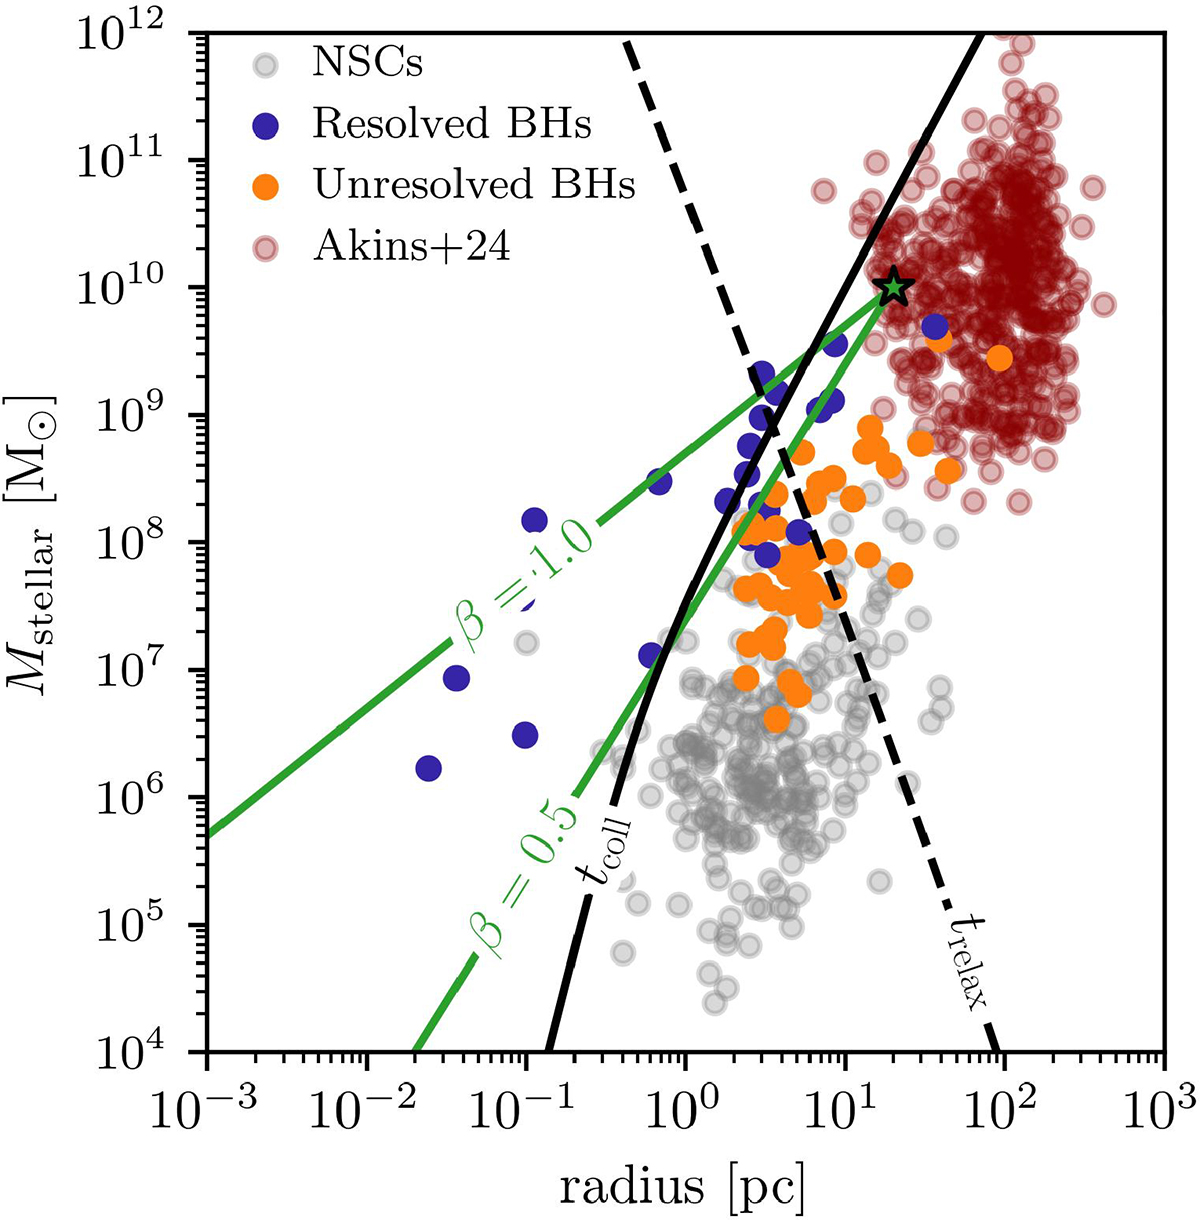
Fig. 3.
Download original image
Mass-radius diagram for stellar systems to illustrate relevant timescales and the position of different sources in different parts of the parameter space. The red dots show LRDs from A+24, gray dots show NSCs in the local Universe (Georgiev et al. 2016; Neumayer et al. 2020), blue dots show well-resolved BHs, and orange dots show spatially unresolved BHs (Gültekin et al. 2009; Escala 2021). The solid black line represents the collisional timescale tcoll = 13.7 Gyr, and the dashed black line shows the relaxation time for trelax = 13.7 Gyr. We include (in green) a fiducial galaxy with mass 1010 M⊙ and radius 20 pc to show its trajectory in the mass-radius plane for β = 1 and 0.5, as defined in Eq. (3). The time evolution of the green line is from left to right.
Current usage metrics show cumulative count of Article Views (full-text article views including HTML views, PDF and ePub downloads, according to the available data) and Abstracts Views on Vision4Press platform.
Data correspond to usage on the plateform after 2015. The current usage metrics is available 48-96 hours after online publication and is updated daily on week days.
Initial download of the metrics may take a while.