Fig. 4.
Download original image
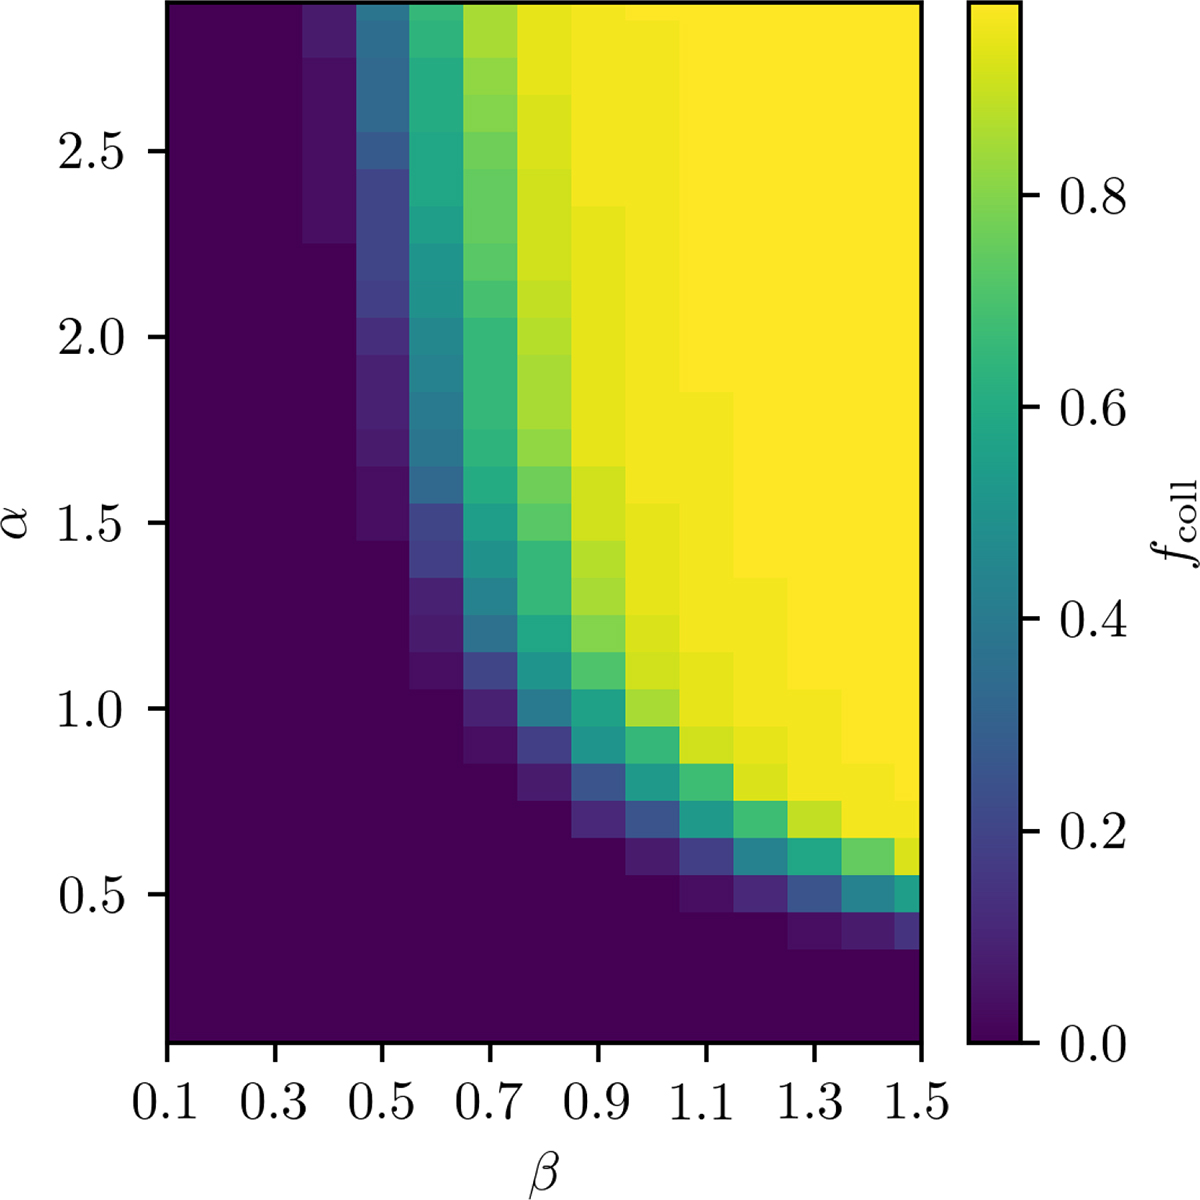
Fraction of galaxies in which BH formation is driven by the condition t = tcoll as a function of the power-law exponents α and β . The x-axis represents the exponent in the mass-radius relation ![]() , and the y-axis represents the exponent in the mass-time relation Mgal ∝ tα. The color bar shows fcoll and indicates the percentage of galaxies in which BH formation specifically satisfies t = tcoll.
, and the y-axis represents the exponent in the mass-time relation Mgal ∝ tα. The color bar shows fcoll and indicates the percentage of galaxies in which BH formation specifically satisfies t = tcoll.
Current usage metrics show cumulative count of Article Views (full-text article views including HTML views, PDF and ePub downloads, according to the available data) and Abstracts Views on Vision4Press platform.
Data correspond to usage on the plateform after 2015. The current usage metrics is available 48-96 hours after online publication and is updated daily on week days.
Initial download of the metrics may take a while.