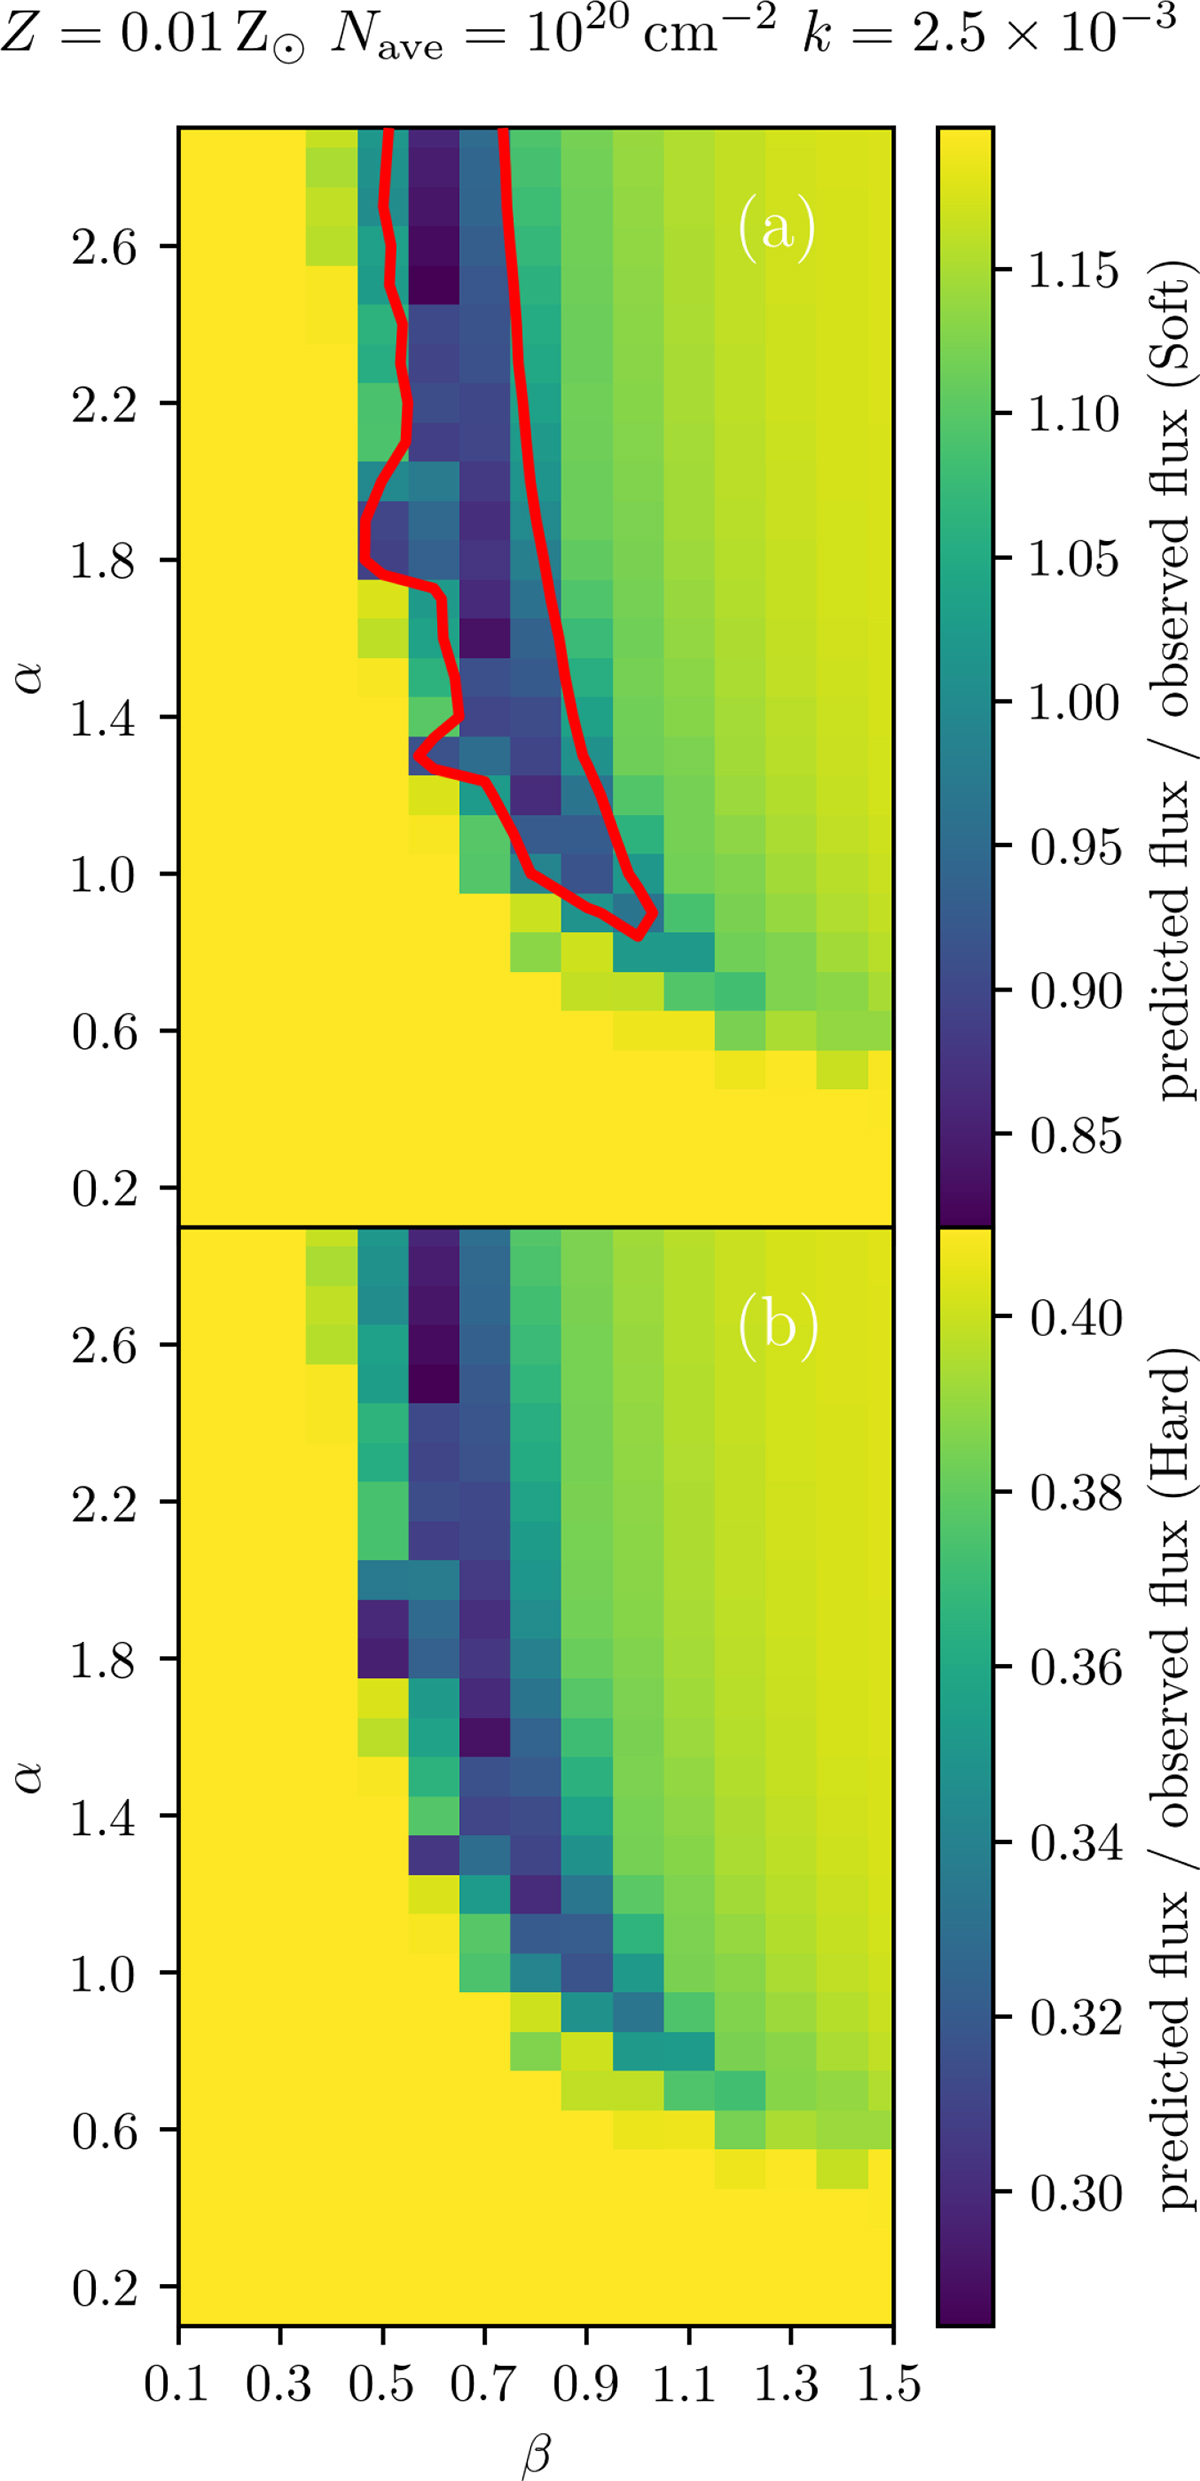
Fig. 7.
Download original image
Panel (a): Soft X-ray band (0.3 − 2 keV). Panel (b): Hard X-ray band (2 − 7 keV). The color bar shows the ratio of the predicted and observed flux for the soft and hard bands. The allowed parameter space for α and β is the region where the ratio of the predicted flux to the observed flux is lower than 1, which satisfies the soft X-ray and hard X-ray observational constraints, respectively. The red line represents ratio of the predicted and observed flux equal to one.
Current usage metrics show cumulative count of Article Views (full-text article views including HTML views, PDF and ePub downloads, according to the available data) and Abstracts Views on Vision4Press platform.
Data correspond to usage on the plateform after 2015. The current usage metrics is available 48-96 hours after online publication and is updated daily on week days.
Initial download of the metrics may take a while.