Fig. 9.
Download original image
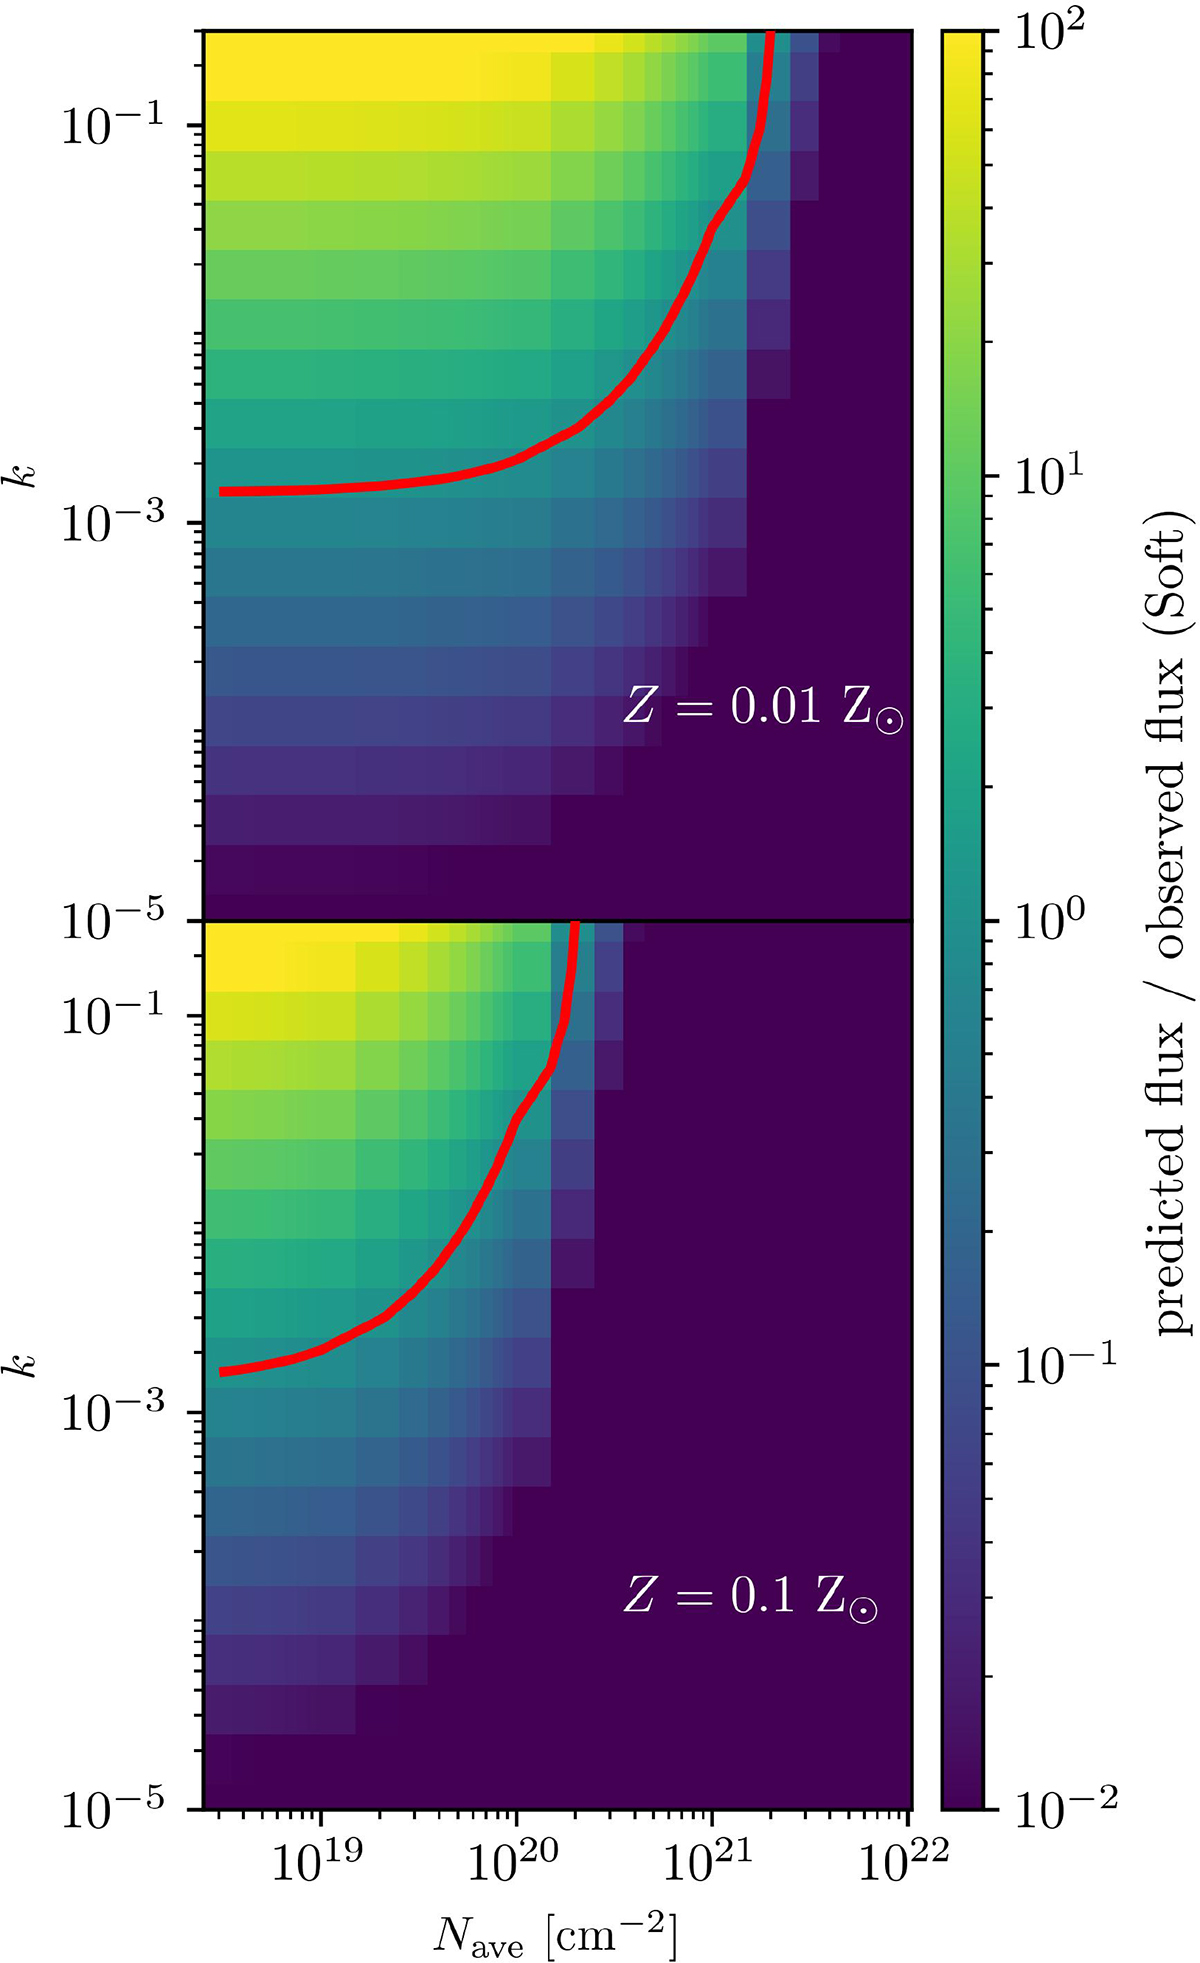
Ratio of the predicted flux from our BH population and the observed limits in the soft band (0.3–2 keV; shown by the color bar). The y-axis shows the possible values for ![]() assuming a metallicity equal to Z = 0.01 Z⊙ (top panel) and Z = 0.1 Z⊙ (bottom panel). The x-axis is the average column density Nave in units of cm−2. The solid red line denotes the curve where the transition from overprediction occurs.
assuming a metallicity equal to Z = 0.01 Z⊙ (top panel) and Z = 0.1 Z⊙ (bottom panel). The x-axis is the average column density Nave in units of cm−2. The solid red line denotes the curve where the transition from overprediction occurs.
Current usage metrics show cumulative count of Article Views (full-text article views including HTML views, PDF and ePub downloads, according to the available data) and Abstracts Views on Vision4Press platform.
Data correspond to usage on the plateform after 2015. The current usage metrics is available 48-96 hours after online publication and is updated daily on week days.
Initial download of the metrics may take a while.