Open Access
Fig. 2
Download original image
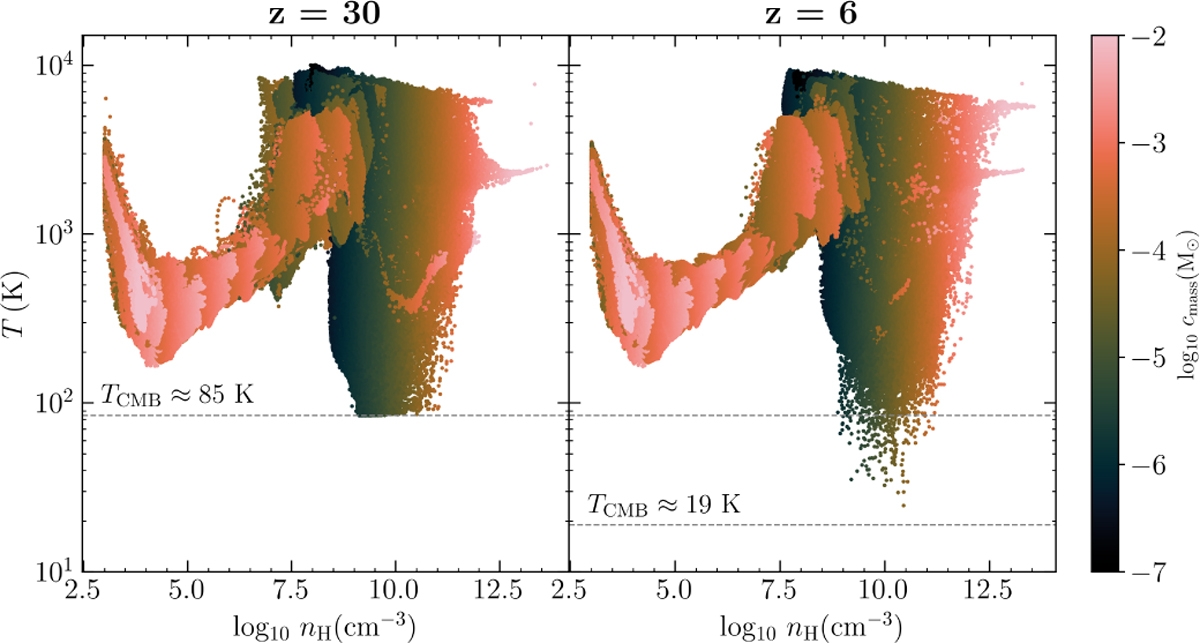
Phase diagrams of the star-forming core in the z = 30 and z = 6 simulations 5000 yr since first star formation, showing gas temperature plotted against number density, color-coded by cell mass. The CMB temperature at z = 30 and at z = 6 is indicated with dashed gray lines.
Current usage metrics show cumulative count of Article Views (full-text article views including HTML views, PDF and ePub downloads, according to the available data) and Abstracts Views on Vision4Press platform.
Data correspond to usage on the plateform after 2015. The current usage metrics is available 48-96 hours after online publication and is updated daily on week days.
Initial download of the metrics may take a while.