| Issue |
A&A
Volume 708, April 2026
|
|
|---|---|---|
| Article Number | A61 | |
| Number of page(s) | 10 | |
| Section | Interstellar and circumstellar matter | |
| DOI | https://doi.org/10.1051/0004-6361/202558114 | |
| Published online | 27 March 2026 | |
Radiation magnetohydrodynamics simulations of Population III star formation during the epoch of reionization
1
Leiden Observatory, Leiden University,
PO Box 9513,
2300 RA
Leiden,
The Netherlands
2
Transdisciplinary Research Area (TRA), Argelander-Institut für Astronomie, University of Bonn,
53113
Bonn,
Germany
3
Department of Physics & Astronomy, University College London,
London
WC1E 6BT,
UK
4
Center for Computational Astrophysics, Flatiron Institute,
162 5th Avenue,
New York,
NY
10010,
USA
5
Department of Physics and Astronomy, Rutgers University,
136 Frelinghuysen Road,
Piscataway,
NJ
08854,
USA
★ Corresponding authors: This email address is being protected from spambots. You need JavaScript enabled to view it.
; This email address is being protected from spambots. You need JavaScript enabled to view it.
Received:
14
November
2025
Accepted:
14
January
2026
Abstract
Cosmological simulations find that pockets of star-forming gas could remain pristine up until the epoch of reionization (EoR) due to the inhomogeneous nature of metal mixing and enrichment in the early Universe. Such pristine clouds could have formed Population III stars, which could have distinct properties compared to their very high redshift (z ≥ 20) counterparts. We investigate how Population III stars form and grow during the EoR, and whether the resulting mass distribution varies with environment or across cosmic time. We perform high-resolution (7.5 au) radiation-magnetohydrodynamics simulations of identical primordial clouds exposed to the cosmic microwave background (CMB) appropriate for z = 30 and z = 6, respectively, as part of the POPSICLE project. We also run a simulation at z = 6 with a strong external Lyman-Werner (LW) background, to span across radiative environments that could host metal-free clumps during the EoR. In the limit of no external LW radiation, we find that while the evolution of the most massive star (M* ≈ 70M⊙) is almost identical between z = 30 and z = 6, the latter exhibits less fragmentation, leading to a smaller cluster of stars with a higher median stellar mass. In the limit of high external LW radiation, we see vigorous accretion and high star formation efficiencies, leading to the formation of very massive (M* > 100 M⊙) stars. Our results suggest that Population III initial mass function (IMF) could vary with redshift simply due to the CMB, independent of the environment. We find that less massive and more compact Pop III star clusters could form during the EoR compared to z ≥ 20, with the formation of very massive and supermassive stars likely in strongly irradiated environments.
Key words: magnetohydrodynamics (MHD) / radiation mechanisms: general / stars: formation / stars: massive / stars: Population III / cosmic background radiation
© The Authors 2026
 Open Access article, published by EDP Sciences, under the terms of the Creative Commons Attribution License (https://creativecommons.org/licenses/by/4.0), which permits unrestricted use, distribution, and reproduction in any medium, provided the original work is properly cited.
This article is published in open access under the Subscribe to Open model. This email address is being protected from spambots. You need JavaScript enabled to view it. to support open access publication.
1 Introduction
It has long been thought that the first generation of stars (Population III) formed from primordial gas around 200-300 Myr after the Big Bang (e.g., Abel et al. 2000, 2002; Bromm et al. 2002; Yoshida et al. 2006). The majority of Population III stars are believed to have formed with a top-heavy initial mass function (IMF), although the exact shape of the Population III IMF and possible variations therein remain a topic of active debate (see the recent review by Klessen & Glover 2023). Low mass (M* < 0.8 M⊙) Population III stars that could have survived today would be rare (Stacy & Bromm 2014; Hartwig et al. 2015; Rossi et al. 2021) and extremely challenging to identify (e.g., Frebel & Norris 2015; Ishiyama et al. 2016; Magg et al. 2018). More than 20 hours of observing time on the James Webb Space Telescope (JWST) have been dedicated to Population III star searches, but so far only tentative evidence for a Population III galaxy or cluster has been reported (Maiolino et al. 2024; Fujimoto et al. 2025). Detecting light from the era where they dominated the cosmic star formation rate density (SFRD) at z = 20-30 (Klessen & Glover 2023; Venditti et al. 2023) would require instruments capable of detecting objects as faint as 39 magAB, which could only be achieved using the hypothetical Ultimately Large Telescope with a mirror of a diameter of 100 m placed on the moon (Schauer et al. 2020). These constraints limit the possibility of directly detecting Pop III stars at an epoch where they are expected to be abundant, compounded by the fact that most of them would have survived for a short time period given their large masses (Heger & Woosley 2002).
Earlier works demonstrated the possibility that Population III stars might have continued to form during the epoch of reionization (EoR) at z = 6-9 due to the inhomogeneous nature of metal mixing and enrichment in the early Universe (Trenti et al. 2009; Johnson et al. 2013; Muratov et al. 2013; more recently Liu & Bromm 2020). Recent cosmological simulations with more sophisticated treatments of baryonic physics further support the idea of such a late mode formation of Pop III stars (Xu et al. 2016; Venditti et al. 2023; Zier et al. 2025). These simulations show that during the EoR, gas clouds situated in low-mass haloes on the outskirts of a (proto-)galaxy at distances up to ~ 20 kpc from the galactic center could remain pristine for a substantial time. These findings open an exciting avenue for targeted searches for Pop III stars that could be possible with the current generation of facilities (Johnson 2010; Katz et al. 2023; Matthee et al. 2023; Williams et al. 2025).
While cosmological simulations provide a detailed picture of the large-scale environment within which such late mode formation of Pop III stars is possible, they cannot resolve the formation and growth of individual Population III stars, and hence cannot predict an IMF. Semi-analytical models that track the cosmic evolution of Pop III star formation and the Pop III SFRD (e.g., Scannapieco et al. 2003; Greif & Bromm 2006; Visbal et al. 2018; Mebane et al. 2018; Hartwig et al. 2024; Ventura et al. 2024; Hegde & Furlanetto 2025) suffer from similar issues, and do not track all relevant physical processes that can influence the Pop III IMF. As such, it is not yet known what the masses and radiative properties of Pop III stars that formed during the EoR were, and whether they were any different from those at z ≥ 20, as expected from small box but very highresolution hydrodynamical simulations of collapsing primordial clouds (Klessen & Glover 2023, and references therein). As a result, there is substantial scatter in UV luminosity functions and cosmic SFRDs predicted for an EoR Pop III stellar population, which would have implications for their potential observability (Fujimoto et al. 2025, Figures 11 and 12). Making theoretical predictions on the properties of Population III stars during the EoR is essential now that the first direct Population III detection could be within reach thanks to JWST (e.g., Sarmento et al. 2018; Berzin et al. 2021; Nakajima & Maiolino 2022; Vikaeus et al. 2022; Trussler et al. 2023; Zackrisson et al. 2024; Venditti et al. 2024, 2025; Rusta et al. 2025).
Motivated by these possibilities, we carry out the first 3D radiation-magnetohydrodynamics (RMHD) simulations of Population III star formation during the EoR. Our goal is to understand the differences, if any, in the masses and properties of Pop III stars at z = 6 compared to z ≥ 20 when both magnetic fields and stellar radiation feedback are taken into account. We present our simulation setup in Section 2, show and discuss the results in the case of no external radiation in Section 3, explore how external radiation can impact the mass growth of Pop III stars in Section 4, and finally conclude in Section 5.
2 POPSICLE simulations suite
We provide a brief overview of the POPSICLE Project (POP III/II Simulations Including Chemistry, Luminosity and Electromagnetism) setup we use to run the RMHD simulations in this work. For further details on the numerical setup, we refer the reader to Sharda & Menon (2025). We use the FLASH adaptive mesh refinement (AMR) code (Fryxell et al. 2000; Dubey et al. 2013). We use a customized version of the compressible MHD solver developed by Bouchut et al. (2007, 2010) in our simulations (Waagan 2009; Waagan et al. 2011). We employ the VETTAM radiation hydrodynamics scheme, which uses a nonlocal variable Eddington tensor (VET) closure obtained with a ray-trace solve to close the radiation moment equations (Menon et al. 2022). We couple VETTAM to the KROME astrochemistry package (Grassi et al. 2014) to model non-equilibrium primordial chemistry (including deuterium and three-body H2 formation) with H and H2 photoionization and dissociation rates computed from the radiation solution (Menon et al., in prep.). We evolve the radiative properties of protostars as a function of their mass and accretion rates using the GENEVA Pop III protostellar models (Haemmerlé et al. 2017). The protostars are represented as sink particles, following the criteria outlined by Federrath et al. (2010). We do not allow sink particle mergers unless explicitly specified (cf., Section 4.3).
The radiative output of Population III protostars becomes significant for accretion rates below Ṁcrit = 0.01 M⊙ yr−1 (e.g., Omukai & Palla 2003; Hosokawa & Omukai 2009; Haemmerlé et al. 2017). We model the ionization of H and H2 by extreme-UV (EUV) photons, with two bands corresponding to energies hν > 13.6 eV for H and hν > 15.2 eV for H2 ionization respectively (e.g., Baczynski et al. 2015; Sharda & Menon 2025). We also include dissociation of H2 by far-UV (FUV) photons in the Lyman-Werner (LW) band (11.2 eV < hν < 13.6 eV), which can have significant effects on the thermodynamics of dense gas. This LW radiation can originate either in situ from the proto-star(s) or from an external UV background formed by nearby galaxies. Lastly, we incorporate not only self-shielding of H2 but also the often ignored cross-shielding of H2 by H (Draine & Bertoldi 1996; Wolcott-Green & Haiman 2011; Wolcott-Green et al. 2011), which can have a significant impact on the protostellar mass growth and ultimate fate of Pop III stars (Chen et al., in prep.).
To put the context of Pop III star formation during the EoR within the broader literature of Pop III studies, we keep the initial conditions identical to the simulations at z = 30 by Sharda et al. (2025), except that we set z = 6 in our work. This essentially means that we are testing the impact of cosmic microwave background (CMB) radiation on primordial star formation. While the CMB does not matter for star-forming gas at z < 5, it can appreciably modify gas thermodynamics and the IMF at high redshifts, regardless of the metallicity (e.g., Chon et al. 2022; Bate 2023, 2025). Between z = 6 and z = 30, the CMB temperature, TCMB, decreases by ∆TCMB ≈ 66 K, which is a substantial difference even for primordial star-forming gas (e.g., Galli & Palla 1998; Omukai et al. 2005).
The initial cloud mass and radius are 1000 M⊙ and 1 pc, respectively. We initially stir turbulence by implementing a randomly generated trans-sonic velocity field (Mach unity). We set an initial rms magnetic field strength of 28 μG, emulating the upper floor for amplification by small-scale dynamo under primordial conditions predicted by models (e.g., Sur et al. 2010; Federrath et al. 2011b; Schober et al. 2012, 2015), and also seen in simulations (e.g., Turk et al. 2012; Sharda et al. 2021; Díaz et al. 2024). This field strength is equal to 10% of the initial turbulent kinetic energy, and the initial field geometry is completely random without any preferred orientation, as would be expected for a small-scale turbulent dynamo. We initialize the cloud with solid-body rotation, so that its rotational energy is 3 percent of its gravitational energy (e.g., Bromm et al. 2002; Yoshida et al. 2006). We refine with 64 cells per Jeans length, significantly higher than hydrodynamics simulations that include radiation feedback, to correctly capture the effects of shocks on gas chemistry and thermodynamics (Sharda et al. 2021, Appendix A). We allow ten levels of grid refinement based on Jeans length, which leads to a maximum spatial resolution of ∆x = 7.5 au, yielding the density threshold for sink particle formation to be 1013 cm−3. Following Federrath et al. (2011a), we set the accretion zone of the sink particle to 2.5∆x.
Another important distinction between Pop III star formation sites at z = 6 and z ≥ 20 is that the former is likely impinged by external radiation from nearby galaxies due to the lower opacity of the intergalactic medium (IGM) to UV radiation at z = 6 (e.g., Planck Collaboration 2020; Bosman et al. 2022), or because these Pop III clouds could be present in the vicinity of Pop II starbursts (e.g., Johnson et al. 2013; Chen et al. 2017; Venditti et al. 2023). Thus, by neglecting external radiation, our setup represents a conservative lower bound on pristine star-forming environments likely present during the EoR. We discuss the impact of a strong external radiation field later in Section 4.
3 Pop III star formation at z = 30 versus z = 6
In this section, we present and discuss the results from the two simulations (without external radiation) at z = 30 and z = 6, respectively. Through the discussion of stellar evolution and gas characteristics, we will highlight how differences in the CMB can impact Pop III star formation.
3.1 Stellar evolution
In the time period we simulate, fragmentation leads to the formation of several stars in both the z = 30 and z = 6 simulations. In both simulations, the growth of the oldest and the most massive star is almost identical, as we read from Figure 1, which shows the time evolution of the stellar masses and gas accretion rates. Specifically, the first stars grow to 68 M⊙ at both redshifts. It is interesting to note that these stars do not become very massive (M* > 100 M⊙), which is possible in the absence of magnetic fields as the protostars would have been able to accrete more rapidly (Sharda et al. 2025), before stellar radiation feedback can cut off accretion at later times (Hosokawa et al. 2011). The zero age main sequence (ZAMS) mass would not be too different given that accretion onto these objects has declined to rates much lower than 0.01 M⊙ yr−1.
However, contrary to previous expectations, the number and masses of the stars that next form show some surprising differences. We find that 12 and four stars form in the z = 30 and z = 6 simulations, respectively. Intuitively, a lower TCMB would lead to lower Jeans masses and therefore a higher degree of fragmentation, but we observe less fragmentation at z = 6. The accretion rates of the secondary stars manifest in brief, intense bursts at both redshifts. This can be explained by their orbit around the center, where they encounter dense pockets of gas, leading to brief episodes of intense accretion. As a consequence of these episodic bursts, the stellar masses evolve with a few sudden increases after which they plateau. The stellar masses of secondary stars span from 0.1-8M⊙, producing brown dwarfs to red giant stars. At z = 6, the four stars are locked in a quadruple system (following the multiplicity criteria outlined in Bate 2009). At z = 30, we instead find both a quadruple and a binary system, while the remaining stars are isolated. The least massive stars stop accreting by the end of the simulations, due to a combination of dynamical effects (e.g., ejection from gas rich regions) and fragmentation-induced starvation (e.g., Peters et al. 2010; Prole et al. 2022). The median stellar mass at z = 6 is larger than that at z = 30 by 50 percent, and the total mass in stars is smaller by 16 percent, which is not surprising given the smaller fragmentation in the former case.
Given that the Kelvin-Helmholtz time tends to strongly increase towards lower masses for Population III stars (e.g., Schaerer 2002), the intermediate and low-mass stars will have protostellar contraction phases that far surpass the time period we simulate in this work. Therefore, our simulations only span the earliest phases of protostellar evolution for these stars. On the other hand, Population III stars with very high mass tend to reach the main sequence very quickly, with estimates of ≲104 yr for stars with M* ≳ 50 M⊙ (e.g., Nandal et al. 2023; Larkin et al. 2023). Thus, our simulations are unlikely to miss a significant portion of the protostellar evolution of massive Pop III stars.
3.2 Chemistry and thermodynamics
We show the gas phase distribution at t = 5000 yr in Figure 2. The two simulations show a globally similar thermodynamic profile, except that in the z = 6 run, certain pockets of the accretion disk are able to cool down to temperatures below the CMB temperature at z = 30. Given the controlled nature of these simulations, in which only the redshift has been changed, it is likely that the different mass and density distributions of protostars between the two runs are correlated with the decreased TCMB at z = 6. At lower TCMB, the densest gas tends to build up around the center of mass rather than forming secondary clumps (fragmentation) or filaments that are observed in the case with higher TCMB.
We further examine the thermodynamical and chemical properties of the gas, together with the spatial distribution of the stars, in Figure 3. At z = 6, a spiral stream of relatively cold (T ~ 500 K), dense gas surrounds the center. We do not see this feature at z = 30, where the central region has larger amounts of hotter, lower density gas. Furthermore, the disk at z = 6 has evolved to a more compact and tightly wound structure compared to z = 30, which implies higher rotational velocities and angular momentum. Additionally, at z = 6 the stars are concentrated in the central, densest region of the gas, whereas at z = 30 the stars are spread out over much larger distances along individual, denser filaments of the gas. The high-density gas is fully molecular at T ~ 500 K, as we corroborate from the mass fraction of H2 we show in Figure 3. Two partially ionized H II regions are visible in the fourth panel for z = 30 and one for z = 6, indicating that central stars (two for each HII region) have started to emit significant amounts of ionizing radiation as the accretion rates drop, and the star starts to radiate away enough energy to contract to lower radii and raise its temperature (e.g., Schaerer 2002; Hosokawa & Omukai 2009).
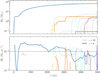 |
Fig. 1 Evolution of individual stellar masses of stars (top), and the mass accretion rate (bottom) for the z = 6 (solid) and z = 30 (dashed) simulations. Ṁcrit denotes the critical accretion rate below which radiation from Population III stars becomes significant. Note that the accretion rates of only the four most massive stars are shown at z = 30 for clarity. |
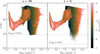 |
Fig. 2 Phase diagrams of the star-forming core in the z = 30 and z = 6 simulations 5000 yr since first star formation, showing gas temperature plotted against number density, color-coded by cell mass. The CMB temperature at z = 30 and at z = 6 is indicated with dashed gray lines. |
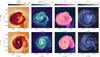 |
Fig. 3 Density-weighted projection plots of gas temperature, number density, and H2 and H+ mass fractions 5000 yr since the formation of the first star. The projections are oriented along the L axis (angular momentum vector of the star-forming disk), zoomed in on the inner 0.01 pc around the center of mass (COM). The top row shows the z = 30 simulation and the bottom row shows the run at z = 6. White dots mark the projected positions of sink particles, which serve as proxies for Pop III stars. |
3.3 Gas kinematics, magnetic fields, and turbulence
We show the kinematics of the gas in the disk in Figure 4. We find much higher (negative) radial velocities, vr, at z = 30 than at z = 6, which rapidly transport gas from the outer parts of the disk to the inner regions. In the vertical direction, the gas shows very similar behavior between the two redshifts, with subdominant motions compared to those in the radial and azimuthal directions. On the other hand, we find higher rotational velocities, vφ, in the z = 6 run compared to z = 30. At z = 6, the entire disk remains intact and shows coherent rotation, whereas at z = 30 enhanced fragmentation produces numerous sinks that disrupt the disk and draw mass and angular momentum from the surrounding gas, leading to less coherent rotation. This is further reflected in the divergence field of the gas velocity (see Figure 5), which depicts how shocks that form within the spiral arms funnel gas towards the central region. At z = 30, we observed enhanced mass buildup at sites away from the center where others stars have formed. The gas develops supersonic turbulence in both cases, likely driven by gravitational instabilities, with turbulent Mach numbers M ~ 10, as we show in the second column of Figure 5.
The third column of Figure 5 shows that the magnetic field strength can reach as high as a few G throughout the central region. In both cases, the magnetic field peaks at the center around the most massive star due to flux-freezing. The field is stronger near the center due to larger magnetic pressure compared to the thermal pressure, leading to plasma β < 1. However, the field strength remains mostly subdominant compared to turbulence, yielding Alfvén Mach numbers ( ) that are larger than unity on average across the disk. Given that the Jeans length λj ∝ (1 + β−1)1/2 (e.g., Federrath & Klessen 2012), the dominating magnetic field pressure leading to lower β values throughout a larger region of the disk at z = 6 implies larger Jeans lengths and Jeans masses. Therefore, enhanced magnetic activity could also play a role in reducing fragmentation at z = 6. Although the magnetic field strength is relatively high, we do not expect non-ideal (magnetohydrodynamic) MHD effects to significantly modify the operation of the small-scale dynamo. This expectation is supported by previous theoretical studies (McKee et al. 2020; Nakauchi et al. 2021) and numerical simulations (Sadanari et al. 2023), which find that the effective diffusivities associated with non-ideal MHD processes remain small compared to the amplification driven by the small-scale dynamo during Pop III star formation. However, non-ideal effects may play a more important role on larger scales (Liao et al. 2021), where they can suppress the large-scale dynamo and lead to reduced mean magnetic field strengths (Sharda et al. 2021, Section 3.4), potentially hindering the launch of protostellar jets and outflows.
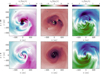 |
Fig. 4 Same as Figure 3 but for the radial, azimuthal (rotational), and vertical velocity. Negative radial motions reflect infall of gas towards the COM. |
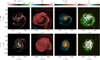 |
Fig. 5 Density-weighted projections along the angular momentum vector of the star-forming disk, showing how mass inflows are impacted by magnetic fields and turbulence. From left to right, the panels show the divergence of the gas velocity field, turbulent Mach number, magnetic field strength, and the ratio of gas pressure over magnetic field pressure through plasma β. Negative values of ∇ ∙ υ indicate net inflow or compression of gas. M > 1 indicates supersonic turbulence and plasma β < 1 indicates that the magnetic field is dominant compared to thermal pressure. |
3.4 What causes the differences in fragmentation at z = 30 and z = 6?
We have seen in the previous sections that, contrary to expectations, we find less fragmentation in the z = 6 simulation, despite the fact that the growth of the most massive star is almost identical at z = 6 and z = 30. To investigate the underlying reason, we study the evolution of the simulations when a second star appears in the z = 30 run but not in the z = 6 run. In Figure 6, we look at key criteria that should be fulfilled to create a new sink particle, namely, the grid element where a sink particle is to be created is at the highest level of refinement, shows locally convergent gas motions, is Jeans unstable, is at the (global or local) minimum of the gravitational potential, and is outside the accretion radius of an existing sink particle.
At z = 6, strong mass inflows (∇ ∙ υ < 0) are concentrated near the center at z = 6, while such inflows also extend to larger radii at z = 30. Additionally, the location where the second sink appears at z = 30 has a local gravitational potential minimum, is dense enough to be at the highest level of refinement and is outside the accretion zone of the existing sink particle. Evidently, this results in the second star formation at z = 30. At z = 6, the gravitational potential is limited to one relatively strong global well and is steeper than the central potential well at z = 30. At z = 6, lower TCMB leads to a very dense, central region where all gas is funneled into, and gets accreted onto the existing star without fragmenting to produce another star. Plasma β in the outer parts of the disk at z = 6 is relatively low compared to that at z = 30. Therefore, magnetic support in the disk could also contribute to restricting the conditions for sink formation at z = 6.
Although we find less fragmentation at z = 6 in this carefully controlled numerical experiment, it is difficult to generalize this conclusion without running an ensemble of simulations to overcome stochasticity due to turbulence (e.g., Wollenberg et al. 2020; Sharda et al. 2020; Riaz et al. 2023). Nonetheless, this exercise provides meaningful insights into how fragmentation behavior and consequently the Pop III stellar masses and multiplicity can vastly differ across redshifts. It also implies that the Population III IMF varies as a function of cosmic time and environment and is very sensitive to the interplay between magnetic fields, radiation feedback, and chemistry of the metal-free gas.
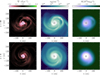 |
Fig. 6 Comparison of some key criteria for sink particle formation, at z = 30 (top row) and at z = 6 (bottom row), right after the formation of the second sink particle at z = 30. From left to right, the columns show density-weighted projections of the divergence of the gas velocity, number density, and gravitational potential. The projected sink particle positions are indicated using white dots, with rings demarcating the accretion zone of the sink particles. |
4 Effects of strong LW radiation background at z = 6
The simulations we have discussed so far were run without an external radiation background, which is reasonable at z = 30 when no galaxies have yet emerged and the IGM is opaque, but only provides a conservative lower bound on the radiation field strength impinging a pristine star formation site during the EoR. A strong LW background radiation field can dissociate H2, raise the minimum cloud mass required to initiate collapse, and significantly alter primordial star formation (e.g., Haiman et al. 1997; Oh & Haiman 2002; Hirano et al. 2015; Skinner & Wise 2020; Schauer et al. 2021; Kulkarni et al. 2021). Only a handful of studies have explored the effects of LW radiation on primordial star formation by resolving down to au scales (e.g., O’Shea & Norman 2008; Prole et al. 2023), but they are limited to moderate or weak LW radiation backgrounds appropriate for z ~ 20, and do not simultaneously include magnetic fields and radiation feedback. To provide an upper bound on the effects of a background (LW) radiation field on Pop III star formation, we ran another RMHD simulation at z = 6 where we kept all initial conditions identical to the run above1, but added an external LW field J21 = 5000, where J21 is the strength of the field normalized to 10−21 erg s−1 cm−2 Hz−1 sr−1; such high values of J21 are rare but can be realized near starburst galaxies during the EoR owing to high escape fractions (e.g., Haiman et al. 2000; Dijkstra et al. 2008; Ahn et al. 2009; Visbal et al. 2020). Furthermore, such values of J21 could also arise from young massive star clusters in the vicinity of metal-free star-forming clumps, which are likely to have high escape fractions (Menon et al. 2025, and references therein). To preserve brevity in the text, we categorize the z = 6 simulation without the external background as J21 = 0 while comparing it with the J21 = 5000 simulation.
As expected (e.g., Wise & Abel 2007; O’Shea & Norman 2008), adding a strong LW radiation background leads to a delay in the onset of the collapse, by ~7 Myr, indicating that gravity must overcome a stronger thermal pressure due to the strongly impaired cooling of the gas as LW radiation dissociates H2. The initial turbulent energy decays by up to 38 percent during this period, but this decay is short-lived due to gravity-driven turbulence post the onset of collapse. Once gravity is able to overcome other forces as more gas is funneled towards the cloud core from larger scales, it triggers a runaway cloud collapse, forming multiple protostars that accrete much more rapidly and are very massive compared to the simulation at z = 6 with J21 = 0. Of the seven stars that form, four have masses M* = 173, 105, 121, and 31 M⊙ within the first 200 yr, with accretion rates as high as 1 M⊙ yr−1. The overall star formation efficiency is almost 5× higher than the J21 = 0 run. Compared to simple powerlaw accretion profiles, we find that mass growth follows a more extreme curve than that seen in the J21 = 0 simulation. Stars follow M* ∝ tp with p ≈ 1.0 in the J21 = 5000 simulation, compared to p ≈ 0.5 in the J21 = 0 simulation (Sharda & Menon 2025, figure 13). At this rate, they would reach ~1000M⊙ within 1000 years, and could act as seeds of intermediate mass or supermassive black holes in the early Universe (e.g., Hosokawa et al. 2012; Latif & Ferrara 2016; Inayoshi et al. 2020; Liu et al. 2024). Below we explore the physical and chemical properties of the externally irradiated star-forming core that gives rise to such vigorous accretion and formation of very massive stars.
4.1 Chemistry and thermodynamics
Figure 7 provides a detailed look into the thermodynamic state of the gas for the two z = 6 simulations with and without external background radiation. The presence of background radiation leads to much hotter gas in the core in the J21 = 5000 run compared to the J21 = 0 run. Nevertheless, the gas column density in regions near the protostars is large enough that the H2 shielding allows the gas to be cooler. It is important to note that the cross-shielding of H2 by H, which has been neglected in previous works, plays an important role along with H2 self-shielding in ensuring that H2 does not dissociate and can cool the gas. Moreover, the radiative outputs from the protostars is low given their extremely high accretion rates, further ensuring there is no ionization and dissociation of H2 due to EUV and FUV photons from the protostars in the J21 = 5000 run.
We also find that fragmentation is enhanced in the J21 = 5000 simulation, leading to the formation of seven stars within the first 200 yr; in contrast, only one star forms in the J21 = 0 run at this point in time. This shows that once collapse is triggered and the gas is shielded, the formation of multiple protostars is quite likely even in high UV environments (Skinner & Wise 2020). Not all seven stars are visible in Figure 7, because the two stars form at a site ~4100 au away from the central cluster but are still bound to the system. The two sites are connected by high-density streams that feed the protostars, leading to high accretion rates. It is likely that some of the protostars located at either site will merge, an aspect that we explore below in Section 4.3.
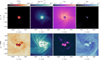 |
Fig. 7 Same as Figure 3, but now comparing the simulations at z = 6 without (top row) and with (bottom row) external radiation, 200 yr after the formation of the first star. Note that the extent of the projection, and the color scales for temperature and number density differ from those in Figure 3. |
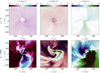 |
Fig. 8 Same as Figure 4, but for the z = 6 simulations without (top row) and with (bottom row) external radiation 200 yr after the formation of the first star. Note that the extent of the projection, and the color scales for temperature and number density differ from those in Figure 4. |
4.2 Gas kinematics, magnetic fields, and turbulence
The impact of the LW background on gas kinematics is quite significant. Figure 8 shows that without a LW background, gas velocities are low, with coherent rotation (vφ > 0), indicative of the presence of a rotating accretion disk around the protostar. In contrast, runaway collapse in the LW background run induces highly chaotic motions, with extreme radial and azimuthal velocities (vr,φ, ≥ 40kms−1) without coherent rotation. This rapid infall of gas towards the center gives rise to high accretion rates and mass growth, which we describe above. Zooming out, Figure 9 reveals that both star formation sites in the J21 = 5000 simulation are embedded within large-scale filamentary gas inflows. The radial velocity structure indicates that each site is fed by intense (vr ~ 30kms−1) asymmetric accretion streams. These inflows suggest that clustered star formation in the LW-irradiated environment is driven by global gravitational collapse rather than local disk instabilities.
Figure 10 reveals the turbulent nature of the infalling gas in the J21 = 5000 run that creates intense shocks (negative values in the divergence of the velocity field that are 10× higher than in the J21 = 0 simulations), leading to vigorous accretion onto the newly formed stars. These regions of strong mass inflows also exhibit enhanced magnetic field strengths and highly supersonic Mach numbers. The peak magnetic field strengths reach values of ≥ 102G in the J21 = 5000 simulation, which is at least 10× larger than the peak strengths we see at the end of the J21 = 0 run (cf. Figure 5). The last column of Figure 10 shows that several patches across the core have plasma β < 1 in the J21 = 5000 run, whereas thermal pressure dominates throughout the core in the J21 = 0 run. Thus, under a strong LW-background, runaway collapse generates a highly turbulent environment with dynamically stronger magnetic fields (see also, Regan & Downes 2018). Nevertheless, the magnetic field is weak compared to gravitational forces, so it cannot significantly hinder gas heating due to compression, and therefore it cannot stop the growth of protostars, as expected based on earlier work without background radiation (Turk et al. 2012; Stacy et al. 2022; Saad et al. 2022; Sharda et al. 2025).
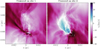 |
Fig. 9 Density-weighted radial velocity of gas, vr, in the frame of reference of the two star formation sites separated by ∼4100 au, in the z = 6 simulation with external radiation background. Both the sites are fed by intense gas inflows, leading to high protostellar accretion rates. |
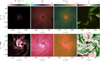 |
Fig. 10 Same as Figure 5, but for the z = 6 simulations without (top row) and with (bottom row) external radiation 200 yr after the formation of the first star. Note that the extent of the projection, and the color scales for temperature and number density differ from those in Figure 5. |
4.3 Stellar mergers?
We do not allow sink mergers in our simulations, as resolving actual protostellar scales (≲7.5, au) is required to capture their likelihood accurately. Modeling stellar mergers also requires resolving very short dynamical timescales, which is typically not achievable or desirable in star formation simulations; otherwise, the long term growth of the protostars cannot be followed (e.g., Krumholz et al. 2004; Bate 2009; Greif et al. 2012; Federrath & Offner 2025). Additionally, conserving angular momentum after sink particle mergers also poses numerical challenges (e.g., Federrath et al. 2011a), and exploring them is beyond the scope of this work. However, we find that some stars show clear signs of the possibility of a merger in the J21 = 5000 simulation: the left panel of Figure 11 shows that soon after the second and third stars form, their stellar radii are larger than their separation for a short time period. To test this possibility, we restart the J21 = 5000 simulation from an epoch right before the formation of the first sink particle, this time allowing for sink particle mergers. We caution, however, that such mergers should be interpreted carefully, as their occurrence and outcome are highly sensitive to the adopted numerical prescriptions and resolution limits.
The right panel of Figure 11 shows that subsequent evolution indeed leads to a merger between the second and third sink, which can be seen in the sudden boost in the mass of the second star. Within 100 yr of this event, the mass of this sink has surpassed that of the first, most massive star. This experiment illustrates how mergers could play a key role in redistributing mass among protostars and altering the multiplicity of the cluster in strong LW radiation environments. Future simulations with the power to resolve down to stellar scales (e.g., Wibking & Krumholz 2022) and improved merger prescriptions (e.g., Rantala et al. 2023) are required to assess their true impact on the Pop III IMF.
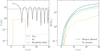 |
Fig. 11 Left panel : comparison between the radius of the third sink, R3, and the spatial separation of the second and third sink particles, dr2,3 in the J21 = 5000 simulation where sink particle mergers are not allowed. The radius of the second sink is similar to R3, so it was left out for simplicity. The solid gray line shows the resolution limit of the simulation. Right panel : evolution of the protostellar mass in runs with (solid) and without (dashed) sink particle mergers. The epoch of the merger corresponds to the time when the solid and dashed lines diverge. The mass of the third star (orange) is added to that of the second star (green), creating a sudden jump in the stellar mass. |
5 Conclusions
In this work, we explore the possibility of Population III star formation during the EoR when pockets of gas within and around galaxy haloes could have remained pristine due to inhomogeneous chemical enrichment (e.g., Xu et al. 2016; Venditti et al. 2023; Zier et al. 2025). We carry out high-resolution (7.5 au) 3D radiation magnetohydrodynamics simulations of collapsing primordial clouds emulating physical conditions appropriate for z = 6 and z = 30 as part of the POPSICLE project (Sharda & Menon 2025). Our goal is to understand how Pop III stars grow and evolve in such conditions and whether any differences are expected in the Pop III IMF during the EoR compared to z ≥ 20. We find that:
In the limit of no external Lyman-Werner radiation (J21 = 0), the key underlying physics that yields differences in the masses of Pop III stars during the EoR (compared to z ≥ 20) is the CMB. Contrary to expectations, we observe less fragmentation at z = 6 (4 stars) than at z = 30 (12 stars), with the most massive stars in both cases growing only to M* ≈ 70 M⊙ due to a combination of feedback from magnetic fields and protostellar radiation;
In the limit of a strong external radiation field ( J21 = 5000, possible near starburst galaxies during the EoR), runaway star formation takes place, leading to the formation of very massive stars (M* > 100 M⊙) with vigorous accretion rates and high star formation efficiencies. Our analysis suggests that protostellar mergers are quite likely in such dense and compact clusters.
Although our findings remain to be statistically confirmed, the fact that merely decreasing TCMB leads to such differences in Pop III star formation behavior hints that there is no universal Population III IMF (see also, Bovill et al. 2024). Our findings also suggest that the external radiation field plays a central role in determining the masses of Pop III stars formed during the EoR: strongly irradiated environments could form very massive Pop III stars regardless of turbulence and magnetic fields, whereas weakly irradiated environments could lead to less massive and more compact clusters with larger median stellar masses than at z ≥ 20.
Acknowledgements
We thank the anonymous referee for their comments that helped improve the clarity of this work. We thank Alessandra Venditti for useful discussions on the EoR, Robert Schulz for help with technical issues, and Matthieu Schaller for reading a pre-print of this paper. PS is supported by the Leiden University Oort Fellowship and the International Astronomical Union - Gruber Foundation (TGF) Fellowship. SV acknowledges support from the European Research Council (ERC) Advanced Grant MOPPEX 833460. SHM is supported by the Flatiron Institute, which is a division of the Simons Foundation. This work was performed using the compute resources from the Academic Leiden Interdisciplinary Cluster Environment (ALICE) provided by Leiden University, as well as the Dutch National Supercomputing Facility SURF via project grants EINF-8292 and EINF-12322 on Snellius. We acknowledge using the following softwares: FLASH (Dubey et al. 2013), KROME (Grassi et al. 2014), VETTAM (Menon et al. 2022), yt (Turk et al. 2011), paramesh (MacNeice et al. 2000), Numpy (Oliphant 2006; Harris et al. 2020), Scipy (Virtanen et al. 2020), Matplotlib (Hunter 2007), and cmasher (Van der Velden 2020).
References
- Abel, T., Bryan, G. L., & Norman, M. L. 2000, ApJ, 540, 39 [NASA ADS] [CrossRef] [Google Scholar]
- Abel, T., Bryan, G. L., & Norman, M. L. 2002, Science, 295, 93 [CrossRef] [Google Scholar]
- Ahn, K., Shapiro, P. R., Iliev, I. T., Mellema, G., & Pen, U.-L. 2009, ApJ, 695, 1430 [Google Scholar]
- Baczynski, C., Glover, S. C. O., & Klessen, R. S. 2015, MNRAS, 454, 380 [CrossRef] [Google Scholar]
- Bate, M. R. 2009, MNRAS, 392, 590 [Google Scholar]
- Bate, M. R. 2023, MNRAS, 519, 688 [Google Scholar]
- Bate, M. R. 2025, MNRAS, 537, 752 [Google Scholar]
- Berzin, E., Secunda, A., Cen, R., Menegas, A., & Götberg, Y. 2021, ApJ, 918, 5 [Google Scholar]
- Bosman, S. E. I., Davies, F. B., Becker, G. D., et al. 2022, MNRAS, 514, 55 [NASA ADS] [CrossRef] [Google Scholar]
- Bouchut, F., Klingenberg, C., & Waagan, K. 2007, Numer. Math., 108, 7 [Google Scholar]
- Bouchut, F., Klingenberg, C., & Waagan, K. 2010, Numer. Math., 115, 647 [Google Scholar]
- Bovill, M. S., Stiavelli, M., Wiggins, A. I., Ricotti, M., & Trenti, M. 2024, ApJ, 962, 49 [NASA ADS] [CrossRef] [Google Scholar]
- Bromm, V., Coppi, P. S., & Larson, R. B. 2002, ApJ, 564, 23 [Google Scholar]
- Chen, K.-J., Whalen, D. J., Wollenberg, K. M. J., Glover, S. C. O., & Klessen, R. S. 2017, ApJ, 844, 111 [Google Scholar]
- Chon, S., Ono, H., Omukai, K., & Schneider, R. 2022, MNRAS, 514, 4639 [NASA ADS] [CrossRef] [Google Scholar]
- Díaz, V. B., Schleicher, D. R. G., Latif, M. A., Grete, P., & Banerjee, R. 2024, A&A, 684, A195 [NASA ADS] [CrossRef] [EDP Sciences] [Google Scholar]
- Dijkstra, M., Haiman, Z., Mesinger, A., & Wyithe, J. S. B. 2008, MNRAS, 391, 1961 [NASA ADS] [CrossRef] [Google Scholar]
- Draine, B. T., & Bertoldi, F. 1996, ApJ, 468, 269 [Google Scholar]
- Dubey, A., Antypas, K., Calder, A., et al. 2013, in 2013 5th International Workshop on Software Engineering for Computational Science and Engineering (SE-CSE), 1 [Google Scholar]
- Federrath, C., & Klessen, R. S. 2012, ApJ, 761, 156 [Google Scholar]
- Federrath, C., & Offner, S. 2025, arXiv e-prints [arXiv:2510.12203] [Google Scholar]
- Frebel, A., & Norris, J. E. 2015, ARA&A, 53, 631 [NASA ADS] [CrossRef] [Google Scholar]
- Federrath, C., Banerjee, R., Seifried, D., Clark, P. C., & Klessen, R. S. 2010, Proc. Int. Astron. Union, 6, 425 [Google Scholar]
- Federrath, C., Banerjee, R., Seifried, D., Clark, P. C., & Klessen, R. S. 2011a, in IAU Symposium, 270, Computational Star Formation, eds. J. Alves, B. G. Elmegreen, J. M. Girart, & V. Trimble, 425 [Google Scholar]
- Federrath, C., Chabrier, G., Schober, J., et al. 2011b, Phys. Rev. Lett., 107, 114504 [NASA ADS] [CrossRef] [Google Scholar]
- Fryxell, B., Olson, K., Ricker, P., et al. 2000, ApJS, 131, 273 [Google Scholar]
- Fujimoto, S., Naidu, R. P., Chisholm, J., et al. 2025, ApJ, 989, 46 [Google Scholar]
- Galli, D., & Palla, F. 1998, A&A, 335, 403 [NASA ADS] [Google Scholar]
- Grassi, T., Bovino, S., Schleicher, D. R. G., et al. 2014, MNRAS, 439, 2386 [Google Scholar]
- Greif, T. H., & Bromm, V. 2006, MNRAS, 373, 128 [NASA ADS] [CrossRef] [Google Scholar]
- Greif, T. H., Bromm, V., Clark, P. C., et al. 2012, MNRAS, 424, 399 [NASA ADS] [CrossRef] [Google Scholar]
- Haemmerlé, L., Woods, T. E., Klessen, R. S., Heger, A., & Whalen, D. J. 2017, MNRAS, 474, 2757 [Google Scholar]
- Haiman, Z., Abel, T., & Rees, M. J. 2000, ApJ, 534, 11 [NASA ADS] [CrossRef] [Google Scholar]
- Haiman, Z., Rees, M. J., & Loeb, A. 1997, ApJ, 476, 458 [NASA ADS] [CrossRef] [Google Scholar]
- Harris, C. R., Jarrod Millman, K., van der Walt, S. J., et al. 2020, Nature, 585, 357 [NASA ADS] [CrossRef] [Google Scholar]
- Hartwig, T., Bromm, V., Klessen, R. S., & Glover, S. C. O. 2015, MNRAS, 447, 3892 [NASA ADS] [CrossRef] [Google Scholar]
- Hartwig, T., Lipatova, V., Glover, S. C. O., & Klessen, R. S. 2024, MNRAS, 535, 516 [Google Scholar]
- Hegde, S., & Furlanetto, S. R. 2025, Open J. Astrophys., 8, 147 [Google Scholar]
- Heger, A., & Woosley, S. E. 2002, ApJ, 567, 532 [Google Scholar]
- Hirano, S., Hosokawa, T., Yoshida, N., Omukai, K., & Yorke, H. W. 2015, MNRAS, 448, 568 [NASA ADS] [CrossRef] [Google Scholar]
- Hosokawa, T., & Omukai, K. 2009, ApJ, 703, 1810 [NASA ADS] [CrossRef] [Google Scholar]
- Hosokawa, T., Omukai, K., Yoshida, N., & Yorke, H. W. 2011, Science, 334, 1250 [CrossRef] [Google Scholar]
- Hosokawa, T., Omukai, K., & Yorke, H. W. 2012, ApJ, 756, 93 [Google Scholar]
- Hunter, J. D. 2007, Comput. Sci. Eng., 9, 90 [NASA ADS] [CrossRef] [Google Scholar]
- Inayoshi, K., Visbal, E., & Haiman, Z. 2020, ARA&A, 58, 27 [NASA ADS] [CrossRef] [Google Scholar]
- Ishiyama, T., Sudo, K., Yokoi, S., et al. 2016, ApJ, 826, 9 [Google Scholar]
- Johnson, J. L. 2010, MNRAS, 404, 1425 [NASA ADS] [Google Scholar]
- Johnson, J. L., Dalla Vecchia, C., & Khochfar, S. 2013, MNRAS, 428, 1857 [NASA ADS] [CrossRef] [Google Scholar]
- Katz, H., Kimm, T., Ellis, R. S., Devriendt, J., & Slyz, A. 2023, MNRAS, 524, 351 [CrossRef] [Google Scholar]
- Klessen, R. S., & Glover, S. C. 2023, ARA&A, 61, 65 [NASA ADS] [CrossRef] [Google Scholar]
- Krumholz, M. R., McKee, C. F., & Klein, R. I. 2004, ApJ, 611, 399 [NASA ADS] [CrossRef] [Google Scholar]
- Kulkarni, M., Visbal, E., & Bryan, G. L. 2021, ApJ, 917, 40 [NASA ADS] [CrossRef] [Google Scholar]
- Larkin, M. M., Gerasimov, R., & Burgasser, A. J. 2023, AJ, 165, 2 [NASA ADS] [CrossRef] [Google Scholar]
- Latif, M. A., & Ferrara, A. 2016, PASA, 33, e051 [NASA ADS] [CrossRef] [Google Scholar]
- Liao, W.-T., Turk, M., & Schive, H.-Y. 2021, ApJ, 909, 37 [Google Scholar]
- Liu, B., & Bromm, V. 2020, MNRAS, 497, 2839 [NASA ADS] [CrossRef] [Google Scholar]
- Liu, B., Gurian, J., Inayoshi, K., et al. 2024, MNRAS, 534, 290 [Google Scholar]
- MacNeice, P., Olson, K. M., Mobarry, C., de Fainchtein, R., & Packer, C. 2000, Comput. Phys. Commun., 126, 330 [NASA ADS] [CrossRef] [Google Scholar]
- Magg, M., Hartwig, T., Agarwal, B., et al. 2018, MNRAS, 473, 5308 [CrossRef] [Google Scholar]
- Maiolino, R., Übler, H., Perna, M., et al. 2024, A&A, 687, A67 [NASA ADS] [CrossRef] [EDP Sciences] [Google Scholar]
- Matthee, J., Naidu, R., Bezanson, R., et al. 2023, All the Little Things: Pop III Signatures & the Ionizing Photon Budget of Dwarf Galaxies in the Epoch of Reionization, JWST Proposal. Cycle 2, ID. #3516 [Google Scholar]
- McKee, C. F., Stacy, A., & Li, P. S. 2020, MNRAS, 496, 5528 [NASA ADS] [CrossRef] [Google Scholar]
- Mebane, R. H., Mirocha, J., & Furlanetto, S. R. 2018, MNRAS, 479, 4544 [NASA ADS] [CrossRef] [Google Scholar]
- Menon, S. H., Federrath, C., Krumholz, M. R., et al. 2022, MNRAS, 512, 401 [CrossRef] [Google Scholar]
- Menon, S. H., Burkhart, B., Somerville, R. S., Thompson, T. A., & Sternberg, A. 2025, ApJ, 987, 12 [Google Scholar]
- Muratov, A. L., Gnedin, O. Y., Gnedin, N. Y., & Zemp, M. 2013, ApJ, 773, 19 [Google Scholar]
- Nakajima, K., & Maiolino, R. 2022, MNRAS, 513, 5134 [NASA ADS] [CrossRef] [Google Scholar]
- Nakauchi, D., Omukai, K., & Susa, H. 2021, MNRAS, 502, 3394 [Google Scholar]
- Nandal, D., Regan, J. A., Woods, T. E., et al. 2023, A&A, 677, A155 [NASA ADS] [CrossRef] [EDP Sciences] [Google Scholar]
- Oh, S. P., & Haiman, Z. 2002, ApJ, 569, 558 [NASA ADS] [CrossRef] [Google Scholar]
- Oliphant, T. E. 2006, A Guide to NumPy, 1 (Trelgol Publishing USA) [Google Scholar]
- Omukai, K., & Palla, F. 2003, ApJ, 589, 677 [NASA ADS] [CrossRef] [Google Scholar]
- Omukai, K., Tsuribe, T., Schneider, R., & Ferrara, A. 2005, ApJ, 626, 627 [NASA ADS] [CrossRef] [Google Scholar]
- O’Shea, B. W., & Norman, M. L. 2008, ApJ, 673, 14 [CrossRef] [Google Scholar]
- Peters, T., Klessen, R. S., Mac Low, M.-M., & Banerjee, R. 2010, ApJ, 725, 134 [Google Scholar]
- Planck Collaboration VI. 2020, A&A, 641, A6 [NASA ADS] [CrossRef] [EDP Sciences] [Google Scholar]
- Prole, L. R., Clark, P. C., Klessen, R. S., & Glover, S. C. O. 2022, MNRAS, 510, 4019 [NASA ADS] [CrossRef] [Google Scholar]
- Prole, L. R., Schauer, A. T. P., Clark, P. C., et al. 2023, MNRAS, 520, 2081 [NASA ADS] [CrossRef] [Google Scholar]
- Rantala, A., Naab, T., Rizzuto, F. P., et al. 2023, MNRAS, 522, 5180 [CrossRef] [Google Scholar]
- Regan, J. A., & Downes, T. P. 2018, MNRAS, 478, 5037 [NASA ADS] [CrossRef] [Google Scholar]
- Riaz, R., Schleicher, D. R. G., Bovino, S., Vanaverbeke, S., & Klessen, R. S. 2023, MNRAS, 518, 4895 [Google Scholar]
- Rossi, M., Salvadori, S., & Skúladóttir, Á. 2021, MNRAS, 503, 6026 [NASA ADS] [CrossRef] [Google Scholar]
- Rusta, E., Salvadori, S., Gelli, V., et al. 2025, ApJ, 989, L32 [Google Scholar]
- Saad, C. R., Bromm, V., & El Eid, M. 2022, MNRAS, 516, 3130 [NASA ADS] [CrossRef] [Google Scholar]
- Sadanari, K. E., Omukai, K., Sugimura, K., Matsumoto, T., & Tomida, K. 2023, MNRAS, 519, 3076 [Google Scholar]
- Sarmento, R., Scannapieco, E., & Cohen, S. 2018, ApJ, 854, 75 [NASA ADS] [CrossRef] [Google Scholar]
- Scannapieco, E., Schneider, R., & Ferrara, A. 2003, ApJ, 589, 35 [NASA ADS] [CrossRef] [Google Scholar]
- Schaerer, D. 2002, A&A, 382, 28 [NASA ADS] [CrossRef] [EDP Sciences] [Google Scholar]
- Schauer, A. T. P., Drory, N., & Bromm, V. 2020, ApJ, 904, 145 [NASA ADS] [CrossRef] [Google Scholar]
- Schauer, A. T. P., Glover, S. C. O., Klessen, R. S., & Clark, P. 2021, MNRAS, 507, 1775 [NASA ADS] [CrossRef] [Google Scholar]
- Schober, J., Schleicher, D., Federrath, C., et al. 2012, ApJ, 754, 99 [NASA ADS] [CrossRef] [Google Scholar]
- Schober, J., Schleicher, D. R. G., Federrath, C., Bovino, S., & Klessen, R. S. 2015, Phys. Rev. E, 92, 023010 [CrossRef] [Google Scholar]
- Sharda, P., Federrath, C., & Krumholz, M. R. 2020, MNRAS, 497, 336 [NASA ADS] [CrossRef] [Google Scholar]
- Sharda, P., Federrath, C., Krumholz, M. R., & Schleicher, D. R. G. 2021, MNRAS, 503, 2014 [NASA ADS] [CrossRef] [Google Scholar]
- Sharda, P., & Menon, S. H. 2025, MNRAS, 540, 1745 [Google Scholar]
- Sharda, P., Menon, S. H., Gerasimov, R., et al. 2025, MNRAS, 541, L1 [Google Scholar]
- Skinner, D., & Wise, J. H. 2020, MNRAS, 492, 4386 [NASA ADS] [CrossRef] [Google Scholar]
- Stacy, A., & Bromm, V. 2014, ApJ, 785, 73 [Google Scholar]
- Stacy, A., McKee, C. F., Lee, A. T., Klein, R. I., & Li, P. S. 2022, MNRAS, 511, 5042 [NASA ADS] [CrossRef] [Google Scholar]
- Sur, S., Schleicher, D. R. G., Banerjee, R., Federrath, C., & Klessen, R. S. 2010, ApJ, 721, L134 [NASA ADS] [CrossRef] [Google Scholar]
- Trenti, M., Stiavelli, M., & Shull, J. M. 2009, ApJ, 700, 1672 [Google Scholar]
- Trussler, J. A. A., Conselice, C. J., Adams, N. J., et al. 2023, MNRAS, 525, 5328 [NASA ADS] [CrossRef] [Google Scholar]
- Turk, M. J., Smith, B. D., Oishi, J. S., et al. 2011, ApJS, 192, 9 [NASA ADS] [CrossRef] [Google Scholar]
- Turk, M. J., Oishi, J. S., Abel, T., & Bryan, G. L. 2012, ApJ, 745, 154 [NASA ADS] [CrossRef] [Google Scholar]
- Van der Velden, E. 2020, J. Open Source Softw., 5, 2004 [NASA ADS] [CrossRef] [Google Scholar]
- Venditti, A., Graziani, L., Schneider, R., et al. 2023, MNRAS, 522, 3809 [NASA ADS] [CrossRef] [Google Scholar]
- Venditti, A., Bromm, V., Finkelstein, S. L., et al. 2024, ApJ, 973, L12 [NASA ADS] [CrossRef] [Google Scholar]
- Venditti, A., Munoz, J. B., Bromm, V., et al. 2025, arXiv e-prints [arXiv:2505.20263] [Google Scholar]
- Ventura, E. M., Qin, Y., Balu, S., & Wyithe, J. S. B. 2024, MNRAS, 529, 628 [Google Scholar]
- Vikaeus, A., Zackrisson, E., Schaerer, D., et al. 2022, MNRAS, 512, 3030 [NASA ADS] [CrossRef] [Google Scholar]
- Virtanen, P., Gommers, R., Oliphant, T. E., et al. 2020, Nat. Methods, 17, 261 [Google Scholar]
- Visbal, E., Bryan, G. L., & Haiman, Z. 2020, ApJ, 897, 95 [NASA ADS] [CrossRef] [Google Scholar]
- Visbal, E., Haiman, Z., & Bryan, G. L. 2018, MNRAS, 475, 5246 [NASA ADS] [CrossRef] [Google Scholar]
- Waagan, K. 2009, J. Computat. Phys., 228, 8609 [NASA ADS] [CrossRef] [Google Scholar]
- Waagan, K., Federrath, C., & Klingenberg, C. 2011, J. Computat. Phys., 230, 3331 [NASA ADS] [CrossRef] [Google Scholar]
- Wibking, B. D., & Krumholz, M. R. 2022, MNRAS, 512, 1430 [Google Scholar]
- Williams, C. E., Naoz, S., Yoshida, N., et al. 2025, arXiv e-prints [arXiv:2509.22776] [Google Scholar]
- Wise, J. H., & Abel, T. 2007, ApJ, 671, 1559 [Google Scholar]
- Wolcott-Green, J., & Haiman, Z. 2011, MNRAS, 412, 2603 [Google Scholar]
- Wolcott-Green, J., Haiman, Z., & Bryan, G. L. 2011, MNRAS, 418, 838 [NASA ADS] [CrossRef] [Google Scholar]
- Wollenberg, K. M. J., Glover, S. C. O., Clark, P. C., & Klessen, R. S. 2020, MNRAS, 494, 1871 [NASA ADS] [CrossRef] [Google Scholar]
- Xu, H., Norman, M. L., O’Shea, B. W., & Wise, J. H. 2016, ApJ, 823, 140 [NASA ADS] [CrossRef] [Google Scholar]
- Yoshida, N., Omukai, K., Hernquist, L., & Abel, T. 2006, ApJ, 652, 6 [NASA ADS] [CrossRef] [Google Scholar]
- Zackrisson, E., Hultquist, A., Kordt, A., et al. 2024, MNRAS, 533, 2727 [NASA ADS] [CrossRef] [Google Scholar]
- Zier, O., Kannan, R., Smith, A., et al. 2025, MNRAS, 544, 410 [Google Scholar]
One might wonder whether it is appropriate to assume that the smallscale dynamo operates when the LW background is strong (J21 > 1). Recent cosmological simulations by Diaz et al. (2024) have shown that this is indeed the case: the small-scale dynamo remains active and amplifies the field even for J21 > 5000. Thus, it is reasonable to adopt the same initial magnetic field strength in both the simulations.
All Figures
|
Fig. 1 Evolution of individual stellar masses of stars (top), and the mass accretion rate (bottom) for the z = 6 (solid) and z = 30 (dashed) simulations. Ṁcrit denotes the critical accretion rate below which radiation from Population III stars becomes significant. Note that the accretion rates of only the four most massive stars are shown at z = 30 for clarity. |
| In the text | |
|
Fig. 2 Phase diagrams of the star-forming core in the z = 30 and z = 6 simulations 5000 yr since first star formation, showing gas temperature plotted against number density, color-coded by cell mass. The CMB temperature at z = 30 and at z = 6 is indicated with dashed gray lines. |
| In the text | |
|
Fig. 3 Density-weighted projection plots of gas temperature, number density, and H2 and H+ mass fractions 5000 yr since the formation of the first star. The projections are oriented along the L axis (angular momentum vector of the star-forming disk), zoomed in on the inner 0.01 pc around the center of mass (COM). The top row shows the z = 30 simulation and the bottom row shows the run at z = 6. White dots mark the projected positions of sink particles, which serve as proxies for Pop III stars. |
| In the text | |
|
Fig. 4 Same as Figure 3 but for the radial, azimuthal (rotational), and vertical velocity. Negative radial motions reflect infall of gas towards the COM. |
| In the text | |
|
Fig. 5 Density-weighted projections along the angular momentum vector of the star-forming disk, showing how mass inflows are impacted by magnetic fields and turbulence. From left to right, the panels show the divergence of the gas velocity field, turbulent Mach number, magnetic field strength, and the ratio of gas pressure over magnetic field pressure through plasma β. Negative values of ∇ ∙ υ indicate net inflow or compression of gas. M > 1 indicates supersonic turbulence and plasma β < 1 indicates that the magnetic field is dominant compared to thermal pressure. |
| In the text | |
|
Fig. 6 Comparison of some key criteria for sink particle formation, at z = 30 (top row) and at z = 6 (bottom row), right after the formation of the second sink particle at z = 30. From left to right, the columns show density-weighted projections of the divergence of the gas velocity, number density, and gravitational potential. The projected sink particle positions are indicated using white dots, with rings demarcating the accretion zone of the sink particles. |
| In the text | |
|
Fig. 7 Same as Figure 3, but now comparing the simulations at z = 6 without (top row) and with (bottom row) external radiation, 200 yr after the formation of the first star. Note that the extent of the projection, and the color scales for temperature and number density differ from those in Figure 3. |
| In the text | |
|
Fig. 8 Same as Figure 4, but for the z = 6 simulations without (top row) and with (bottom row) external radiation 200 yr after the formation of the first star. Note that the extent of the projection, and the color scales for temperature and number density differ from those in Figure 4. |
| In the text | |
|
Fig. 9 Density-weighted radial velocity of gas, vr, in the frame of reference of the two star formation sites separated by ∼4100 au, in the z = 6 simulation with external radiation background. Both the sites are fed by intense gas inflows, leading to high protostellar accretion rates. |
| In the text | |
|
Fig. 10 Same as Figure 5, but for the z = 6 simulations without (top row) and with (bottom row) external radiation 200 yr after the formation of the first star. Note that the extent of the projection, and the color scales for temperature and number density differ from those in Figure 5. |
| In the text | |
|
Fig. 11 Left panel : comparison between the radius of the third sink, R3, and the spatial separation of the second and third sink particles, dr2,3 in the J21 = 5000 simulation where sink particle mergers are not allowed. The radius of the second sink is similar to R3, so it was left out for simplicity. The solid gray line shows the resolution limit of the simulation. Right panel : evolution of the protostellar mass in runs with (solid) and without (dashed) sink particle mergers. The epoch of the merger corresponds to the time when the solid and dashed lines diverge. The mass of the third star (orange) is added to that of the second star (green), creating a sudden jump in the stellar mass. |
| In the text | |
Current usage metrics show cumulative count of Article Views (full-text article views including HTML views, PDF and ePub downloads, according to the available data) and Abstracts Views on Vision4Press platform.
Data correspond to usage on the plateform after 2015. The current usage metrics is available 48-96 hours after online publication and is updated daily on week days.
Initial download of the metrics may take a while.