Fig. 3
Download original image
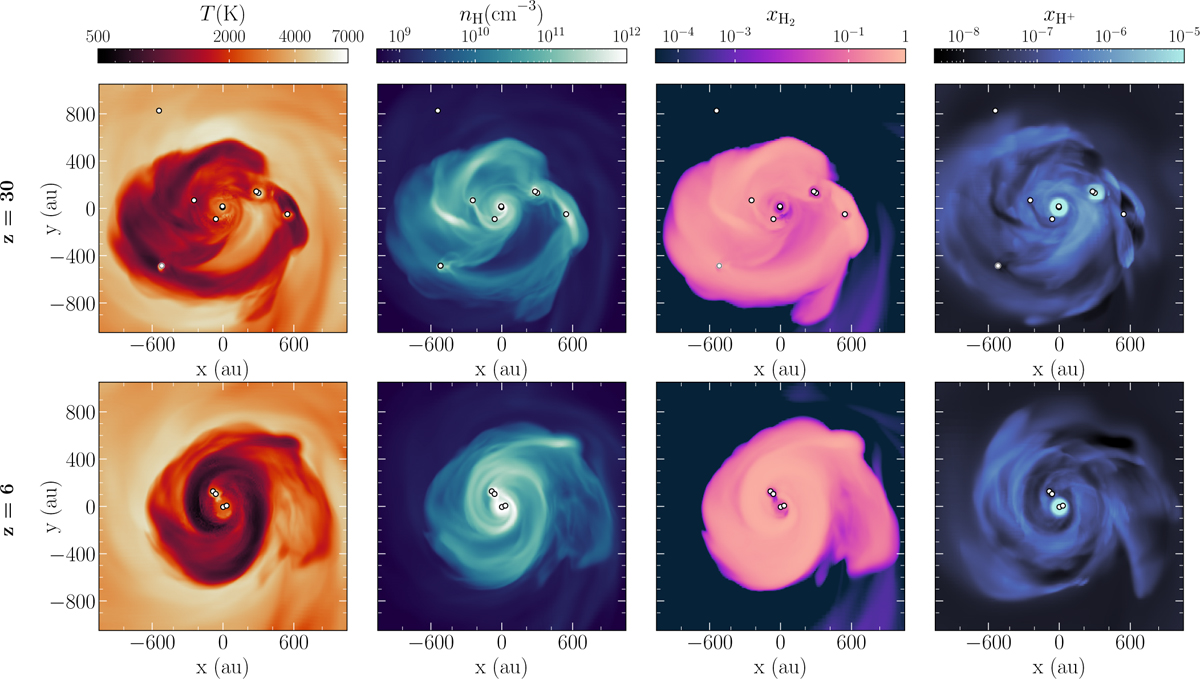
Density-weighted projection plots of gas temperature, number density, and H2 and H+ mass fractions 5000 yr since the formation of the first star. The projections are oriented along the L axis (angular momentum vector of the star-forming disk), zoomed in on the inner 0.01 pc around the center of mass (COM). The top row shows the z = 30 simulation and the bottom row shows the run at z = 6. White dots mark the projected positions of sink particles, which serve as proxies for Pop III stars.
Current usage metrics show cumulative count of Article Views (full-text article views including HTML views, PDF and ePub downloads, according to the available data) and Abstracts Views on Vision4Press platform.
Data correspond to usage on the plateform after 2015. The current usage metrics is available 48-96 hours after online publication and is updated daily on week days.
Initial download of the metrics may take a while.