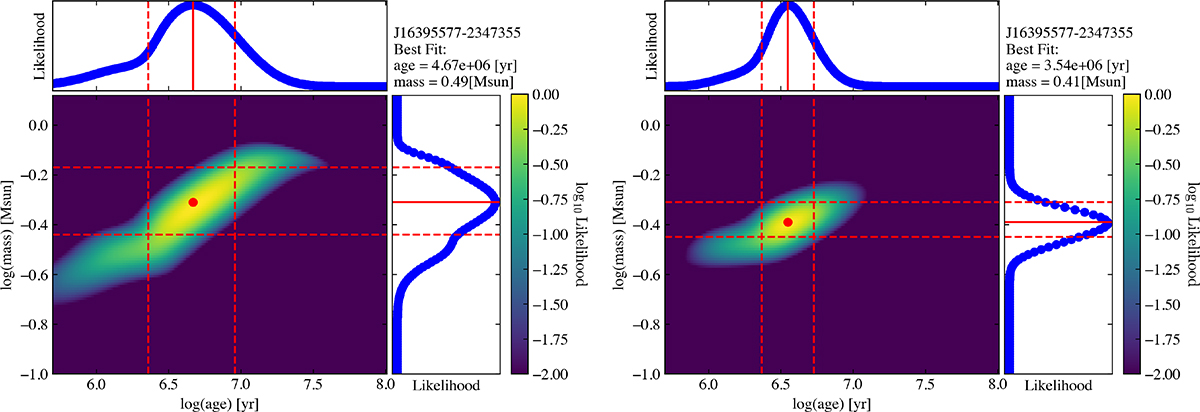
Fig. B.3.
Download original image
Example of age determination improvement by using dynamical stellar mass priors, using J16395577-2347355 as an example. On the left, we show the HR diagram best-fit posteriors of age (top panel) and mass (right panel). On the right, we show the distributions obtained after including a gaussian prior on the stellar mass built on the dynamical measure presented in Zallio et al. (2026). The red dot represents the peak of both the mass and age likelihoods.
Current usage metrics show cumulative count of Article Views (full-text article views including HTML views, PDF and ePub downloads, according to the available data) and Abstracts Views on Vision4Press platform.
Data correspond to usage on the plateform after 2015. The current usage metrics is available 48-96 hours after online publication and is updated daily on week days.
Initial download of the metrics may take a while.