Open Access
Fig. 7.
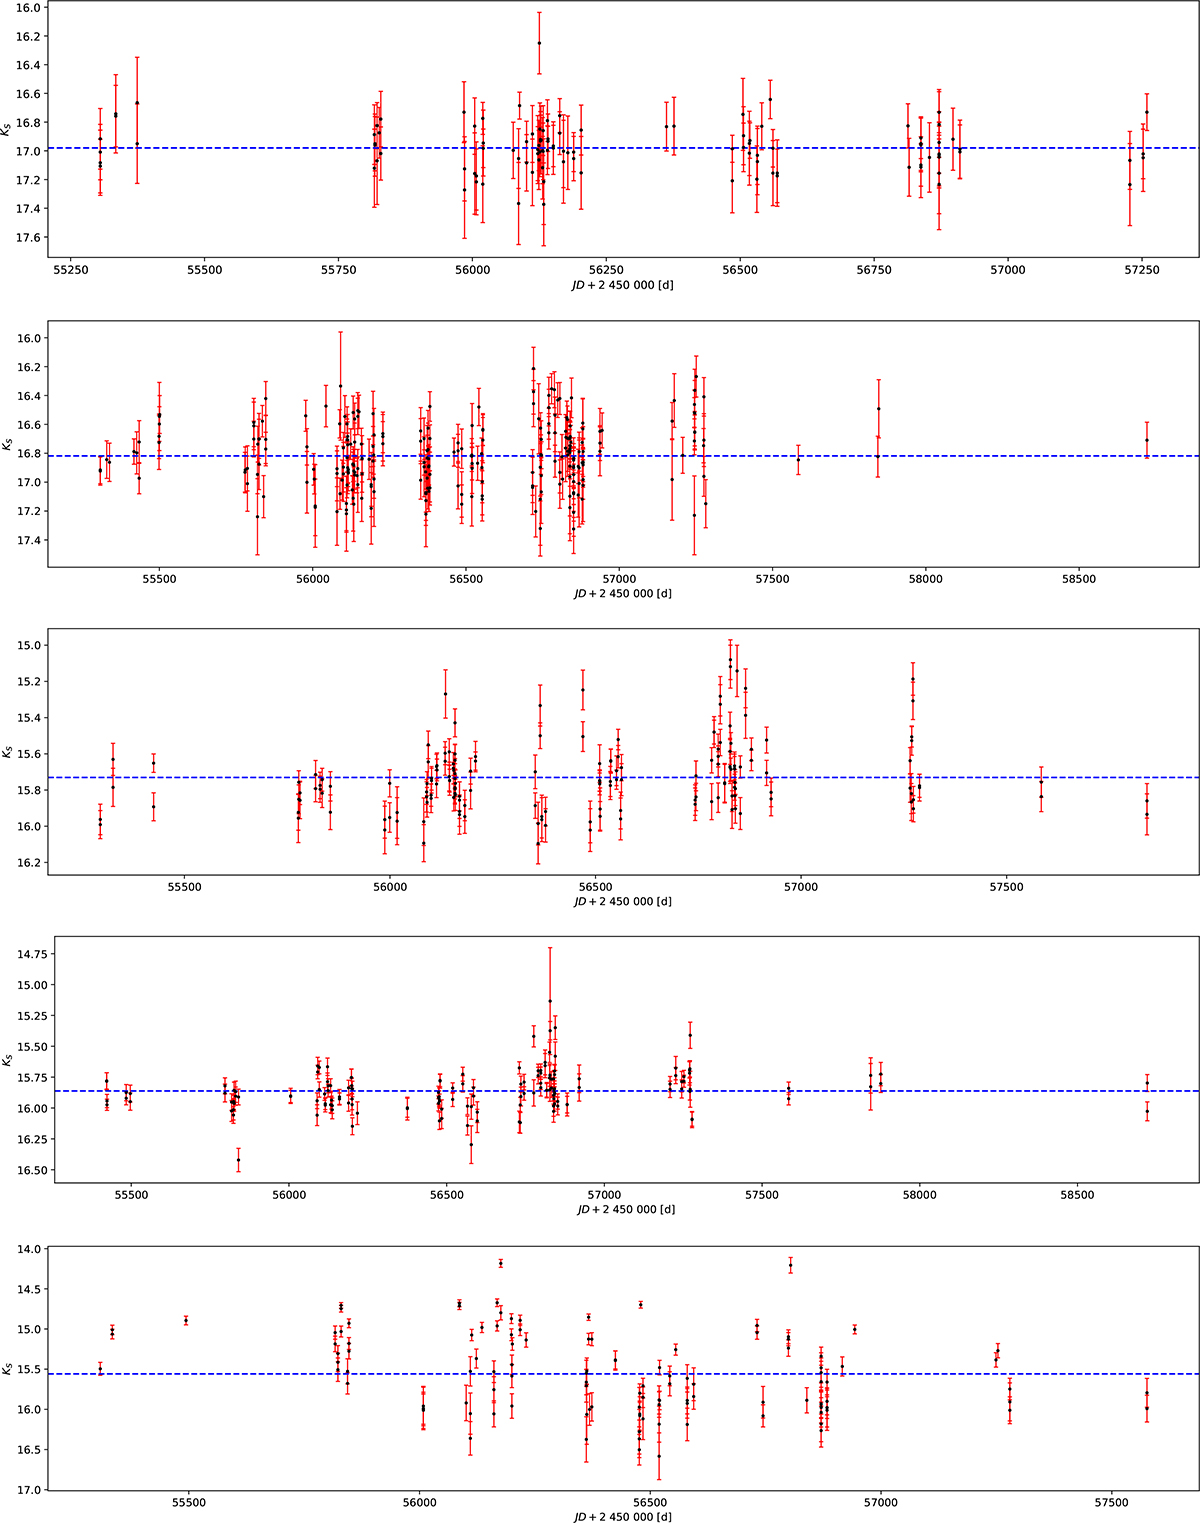
Download original image
Ks-band light-curves for five blazar candidates. The graphics correspond from top to bottom to RS17 (J1745.6-3626), RS23 (J1814.7-3420), RS24 (J1816.4-2727), RS25 (J1817.2-3035), and RS33 (J1828.2-3252). The error bars are shown in red, and the mean value is represented by the blue dashed line.
Current usage metrics show cumulative count of Article Views (full-text article views including HTML views, PDF and ePub downloads, according to the available data) and Abstracts Views on Vision4Press platform.
Data correspond to usage on the plateform after 2015. The current usage metrics is available 48-96 hours after online publication and is updated daily on week days.
Initial download of the metrics may take a while.