| Issue |
A&A
Volume 708, April 2026
|
|
|---|---|---|
| Article Number | A52 | |
| Number of page(s) | 11 | |
| Section | Extragalactic astronomy | |
| DOI | https://doi.org/10.1051/0004-6361/202558182 | |
| Published online | 26 March 2026 | |
Unveiling blazar candidates within unassociated Fermi sources through radio and near-infrared observations
1
Observatorio Astronómico Félix Aguilar, Universidad Nacional de San Juan, Av. Benavidez Oeste, 8175 San Juan, Argentina
2
Consejo Nacional de Investigaciones Científicas y Técnicas (CONICET), Godoy Cruz 2290 Ciudad Autónoma de Buenos Aires, Argentina
3
Instituto de Ciencias Astronómicas de la Tierra y el Espacio (CONICET-UNSJ), Av. España, 1512 sur, San Juan, Argentina
4
Facultad de Ciencias Astronómicas y Geofísicas, Universidad Nacional de La Plata, Paseo del Bosque, B1900FWA, La Plata, Buenos Aires, Argentina
5
Instituto de Astrofísica de La Plata (CONICET-UNLP), Paseo del Bosque, B1900FWA, La Plata, Buenos Aires, Argentina
6
Departamento de Física, Universidade Federal de Santa Catarina, Trindade, 88040-900 Florianópolis, Brazil
7
Instituto de Astrofísica, Departamento de Física y Astronomía, Facultad de Ciencias Exactas, Universidad Andrés Bello, Av. Fernandez Concha 700 Las Condes, Santiago, Chile
8
Vatican Observatory, Specola Vaticana, V00120 Vatican City State, Italy
★ Corresponding author: This email address is being protected from spambots. You need JavaScript enabled to view it.
Received:
19
November
2025
Accepted:
23
February
2026
Abstract
Context. The Fermi Large Area Telescope (LAT) detected 7195 γ-ray sources within the first 12 years of scientific observations, spanning an energy range from 50 MeV to 1 TeV. The fourth source catalog 4FGL-DR4 (Fermi Gamma-ray LAT Data Release 4), contains 2423 unassociated γ-ray sources (UGSs). This catalog provides an excellent opportunity to explore the scientific potential of these high-energy targets and to identify their counterparts at different wavelengths.
Aims. We identified blazar candidates as counterparts to UGSs in the Galactic plane through a multiwavelength analysis of near-infrared and radio observations.
Methods. We compiled an initial list of 318 non-extended Fermi sources located in the Galactic plane. After filtering the list based on interstellar extinction and the 95% confidence Fermi error ellipse, we selected 22 UGS for evaluation. We searched the Very Large Array Sky Survey (VLASS) catalog for sources of continuum radio emission near each target on the sample list. We identified a total of 34 radio sources as potential counterparts to the 22 UGSs within the Fermi error ellipses. We confirmed these radio sources as blazar candidates by analyzing their associated near-infrared sources using the color-magnitude diagram (CMD), color-color diagram (CCD), and Ks-band variability from the VISTA Variables in the Via Lactea (VVV) catalog. Additionally, we examined the radio spectral energy distribution (SED) using observations from the Rapid ASKAP Continuum Survey (RACS).
Results. We found evidence for the association of five UGSs: four with blazar candidates and one with an elliptical galaxy. Additionally, we estimated its SED using RACS bands.
Key words: BL Lacertae objects: general / gamma rays: general / radio continuum: general
© The Authors 2026
 Open Access article, published by EDP Sciences, under the terms of the Creative Commons Attribution License (https://creativecommons.org/licenses/by/4.0), which permits unrestricted use, distribution, and reproduction in any medium, provided the original work is properly cited.
This article is published in open access under the Subscribe to Open model. This email address is being protected from spambots. You need JavaScript enabled to view it. to support open access publication.
1. Introduction
Discovering new extragalactic objects helps us to understand the large-scale structure of the Universe, ensuring better comprehension of cosmic origins and evolution, as well as the interactions between them. Since the beginning of the 20th century, the number of extragalactic objects discovered has increased dramatically. However, identifying and classifying these kinds of objects in the Galactic plane has been a significant challenge for scientists due to the presence of crowded star fields, dust and gas clouds, reddening, and other factors. These block the light emitted by distant objects such as radio galaxies, quasars, and blazars, which constitute an overall family of active galactic nuclei (AGNs).
The accretion of matter around a supermassive black hole powers an AGN, making it one of the most luminous and energetic astrophysical sources known. There are actually 51 different terms used to classify AGNs (Padovani et al. 2017), which are defined by a broadband continuum emission that extends over a much wider spectral range than normal galaxies. Blazars are an AGN subclass, which can be further divided into BL Lacertae objects (see Stickel et al. 1991 and references therein) and flat-spectrum radio quasars (FSRQ; see Chen et al. 2009). According to the Unified Model (Urry & Padovani 1995), an FSRQ may transition into a BL Lac when it loses power, which results in a rotationally driven structure. However, this transition has not yet been fully proven.
A blazar can emit over the entire electromagnetic spectrum, with highly variable emissions ranging from radio waves to γ-rays (i.e., Lister et al. 2019; D’Abrusco et al. 2019; Marchesini et al. 2019; Paiano et al. 2020; Ajello et al. 2020). The spectral energy distribution (SED) of a blazar consists of two main types of component: low-energy components ranging from infrared to X-rays, which are produced by the synchrotron emission of relativistic particles that are accelerated in the blazar jet; and high-energy components ranging from mega-electron-volt to tera-electron-volt, which are associated with inverse Compton scattering (Fossati et al. 1998) or hadronic processes (Peirson et al. 2022). This nonthermal emission manifests as powerful, relativistic jets directed toward Earth, oriented at an angle of a few degrees along the line of sight. Radio continuum emission is also associated with these jets (Blandford & Königl 1979). The correlation between radio and γ-ray emission can be explained by a beaming effect. In this way, Yang et al. (2022) found evidence that γ-ray emission is closely related to radio and optical emission. They also found that γ-ray luminosity is correlated with synchrotron peak luminosity. Massardi et al. (2016) studied a sample of blazar candidates and found that most of them (∼89%) have remarkably smooth spectra that can be well described by a double power law over the full range. This finding suggests the presence of a single emitting region. The flat behavior of a blazar spectrum may result from the superposition of emissions from different compact regions that are self-absorbed at different frequencies.
Since 2008, the Fermi Large Area Telescope (LAT, Atwood et al. 2009) has been studying the γ-ray regime, which is one of the least understood areas of electromagnetic radiation. It has increased the number of high-energy sources by more than an order of magnitude. The fourth source catalog 4FGL-DR4 (Fermi Gamma-ray LAT Data Release 4, Ballet et al. 2023), includes 7195 γ-ray sources, 2423 of which (approximately 34%) are not associated with other wavelengths at lower energies. Ackermann et al. (2012) performed a statistical analysis of the first Fermi-LAT catalog, focusing on unassociated γ-ray sources (UGSs). They concluded that most AGNs should be found among unidentified sources, particularly at low Galactic latitudes. In general, γ-ray sources can be classified in two ways: by analyzing statistical differences in the Fermi-LAT catalogs using machine learning, or by searching for counterparts emission at other wavelengths (Lefaucheur & Pita 2017). One search method is to analyze infrared emissions (Massaro et al. 2011), radio emissions (Massaro et al. 2013), and X-ray emissions (Paggi et al. 2013); another method is to analyze SEDs (Acero et al. 2013). The fifth edition of the Roma-BZCAT catalog of blazars (Massaro et al. 2015) contains the coordinates and multi-frequency data of 3561 blazar sources; however, only 37 of these objects are located on the Galactic plane.
Pichel et al. (2020) used the four-dimensional color space of the near- and mid-infrared (NIR and MIR) to distinguish blazars from other Galactic and extragalactic sources. They used the VISTA Variables in the Via Lactea (VVV, Minniti et al. 2010) and the Wide-field Infrared Survey Explorer (WISE, Wright et al. 2010) for this analysis. In brief, they found that, for each blazar, there was only one VVV source within the 95% confidence positional uncertainty ellipse of the Fermi source. These VVV sources coincide with the Roma-BZCAT blazar’s position and show different photometric properties when compared with stellar and extragalactic objects. Massaro et al. (2011, 2012a,b, 2015) and D’Abrusco et al. (2019) agree that blazars are clearly distinct from other extragalactic sources observed in the MIR. Using data from the WISE survey in four bands centered at 3.4, 4.6, 12, and 22 μm, they identified a region covered only by blazars.
Bruzewski et al. (2021) presented a catalog of 7432 radio counterpart candidates for 1119 unassociated γ-ray sources selected from the 4FGL Data Release 2. The authors used the Very Large Array Sky Survey (VLASS, Gordon et al. 2021) to quick-look data and conducted C-band (4–8 GHz) observations for a total of 57 hours and 2456 pointings. They proposed a method based on the simultaneous detection of radio sources in three different bands. Using this method, they identified 79 compact sources associated with 74 UGS fields and classified them as flat-spectrum sources (spectral index α < −0.5).
Marchesini et al. (2023) conducted a multifrequency study of the blazar WISE J141046.00+740511.2. The researchers combined observations from the Karl G. Jansky Very Large Array (JVLA) radio interferometer, the Giant Metrewave Radio Telescope (GMRT), the Gran Telescopio Canarias (GTC), the Gemini Observatory, the William Herschel Telescope, and the Liverpool Observatory, together with Fermi-LAT and Swift data. They modeled the SED of the source to study the parameters that characterize the radio loudness or weakness of blazars.
Recently, Behiri et al. (2025) discovered a significant correlation between 855-MHz radio emissions and γ-ray luminosity. This finding highlights the important role of relativistic jets. They also found that FSRQs exhibit more efficient high-energy pumping and dominate the bright end of the spectrum in the radio and γ-ray bands. In contrast, BL Lacs exhibit greater variability in their spectral behavior, which reflects their evolutionary differences.
This work aims to identify blazar candidates associated with γ-ray sources detected by the Fermi-LAT mission using a multifrequency analysis of infrared and radio spectra. Collecting information from these spectral regions and associating it with different types of blazars (such as the blazar sequence; see Cavaliere & D’Elia 2002) allowed us to study the physical processes inside these objects and their possible relationship with other types of galaxies with active nuclei.
In Sect. 2, we describe the selection of the UGS sample list that contains radio emission sources in the long radius of the error ellipse for the 95% confidence Fermi sources. In Sect. 3, we define the methodology used to identify candidate blazars associated with radio sources that could be the origin of UGSs. In Sect. 4, we present the results of the five objects detected. Finally, in Sect. 5 we discuss the main results of our work and draw some conclusions.
2. Sample
To select blazar candidates as the origin of UGSs in the Galactic plane, we searched for Fermi sources from the 4FGL-DR4 catalog. Since we planned to use VVV survey data, we defined the search areas as follows: −10° < l < 10° and −10° < b < 5° (bulge), and −65° < l < − 10° and −2° < b < 2° (adjacent section of the midplane). A total of 318 UGSs were found, with 193 in the bulge and 125 in the midplane.
Compared to optical wavelengths, observations at near-infrared wavelengths minimize the effects of interstellar extinction. According to the distributions of interstellar extinction and the Fermi error ellipse, we selected sources with lower interstellar extinction, AKs < 1.2 mag, and a long-radius error ellipse at the 95% confidence level, amaj95 < 5′. The extinction cut (AKs < 1.2 mag) ensures reliable IR/optical detections and minimizes biases introduced by highly reddened regions (see Donoso et al. 2024). The long-radius threshold (amaj95 < 5′), which is close to the median value (amaj95 = 4.25 ± 3.04′), significantly reduces the probability of spurious cross-matches. Together, these criteria yield a sample with sufficient photometric quality for follow-up observations. We used the dust estimations of Schlafly & Finkbeiner (2011) and the Ks-band extinction coefficient of Catelan et al. (2011). This filtering yielded 22 UGSs with no association at other wavelengths.
For the blazar hypothesis, we searched for continuum radio emission sources (hereafter referred to as RSs) as counterparts of γ-ray sources in the S band (2 ≤ ν ≤ 4 GHz) of the VLASS catalog. The search region is defined as the long radius of the error ellipse for the 95% confidence Fermi sources. We searched for radio continuum sources within this region.
For the VLASS catalog results, we eliminated the RSs with a reliability factor (see Gordon et al. 2021) of Quality_flag = 4 (this means that the flux peak is higher than the flux density Fpeak > Ftotal); Quality_flag = 2 (where the Fpeak is 5 times lower than the local rms noise); and Quality_flag = 1 (RSs with lobe structures). Also, we applied the duplicate detection factor and only used the Duplicate_flag = 0 or 1, meaning that the Python Blob Detection and Source Finding code (PyBDSF, Mohan & Rafferty 2015) did not find duplicated sources. Finally, the list includes 22 UGSs containing at least one continuum radio source in the VLASS catalog within the search region. In total, there are 34 RSs, which are listed in Table 1.
List of 34 RSs corresponding to 22 UGSs.
3. Methodology
3.1. Color-color diagrams
We used the photometry of VVV in the Z, Y, J, H, and Ks passbands to find near-IR counterparts of targets from the sample list. Donoso et al. (2024) applied a method to a sample of UGSs in the Galactic regions using the VVV and WISE surveys to identify blazar candidates as counterparts to Fermi-LAT sources. According to the conclusions of Cioni et al. (2011), AGNs with point-like morphologies occupy the A region in the YJKs color-color diagram (CCD), while AGNs with confirmed host galaxies occupy the B region. Objects in the C region are reddened Magellanic sources, and the D region is dominated primarily by stars and low-confidence AGNs. Blazars populate different regions in the CCDs because they are dominated by nonthermal emission in the mid-IR (Pichel et al. 2020). Additionally, Baravalle et al. (2023) defined extragalactic sources in the color-magnitude diagrams (CMDs) using the following color criteria: 0.5 < J − Ks < 2, 0 < J − H < 1, and 0 < H − Ks < 2.
In order to associate the RSs from the VLASS catalog with the NIR sources from the VVV catalog, we must define a search radius around the coordinates of each RS. On the one hand, Roma-BZCAT is the most up-to-date compilation of confirmed blazars. We used this catalog to match with the VLASS catalog to find sources near each object classified as a blazar. Figure 1 shows a histogram of the separation between the blazars in the Roma-BZCAT catalog and the nearby continuum radio sources in the VLASS catalog. The mean value for the 2704 targets classified as blazars is 0.48″.
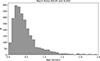 |
Fig. 1. Histogram of separation between the confirmed blazars in the Roma-BZCAT catalog and the nearby continuum radio source in the VLASS catalog, expressed in arcsec. |
On the other hand, the VLASS catalog was compiled using the VLA radio interferometer with an angular resolution of ∼2.5″ for the B and BnA configurations. We defined the search radius as the root-sum-square of the separation between blazar and radio source (0.48″), and the JVLA resolution (∼2.5″). This resulted in a search radius of 2.55″. Only NIR sources located within 2.55″ of an RS from the sample list were considered counterparts for analysis. We show in Figs. 2, 3, 4, 5, and 6 the VVV images in the Ks band with the contour levels of radio continuum emission at the S band of theVLASS catalog.
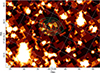 |
Fig. 2. VVV image in Ks band of RS17 (UGS J1745.6-3626). Green lines show the contour levels of the VLASS J174555.05-362331.3 source. |
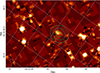 |
Fig. 3. VVV image in Ks band of RS23 (UGS J1814.7-3420). Green lines show the contour levels of the VLASS J181446.75-342340.7 source. |
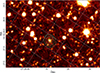 |
Fig. 4. VVV image in Ks band of RS24 (UGS J1816.4-2727). Green lines show the contour levels of the VLASS J181628.79-272602.8 source. |
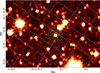 |
Fig. 5. VVV image in Ks band of RS25 (UGS J1817.2-3035). Green lines show the contour levels of the VLASS J181720.39-303258.5 source. |
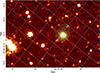 |
Fig. 6. VVV image in Ks band of RS33 (UGS J1828.2-3252). Green lines show the contour levels of the VLASS J182817.08-325520.5 source. |
CMDs and CCD are constructed using the VVV passbands1YJKs for selected NIR and other sources in the region. Using the classification criteria from Cioni et al. (2013), and the results obtained by Baravalle et al. (2023), we identified five NIR sources as extragalactic objects that satisfy these criteria and are potential blazar candidates for the UGSs J1745.6-3626, J1814.7-3420, J1816.4-2727, J1817.2-3035, and J1828.2-3252. The CMDs and CCD are shown in Appendix A. For the remaining 16 UGS, there is no NIR source near the radio source that meets the CCD criteria. Table 2 summarizes the NIR sources that could be extragalactic and includes their magnitudes at the Z, Y, J, H, and Ks passbands, as well as their coordinates and separation from the RS.
List of five NIR sources that could be extragalactic sources associated with UGS.
3.2. Variability
We performed a variability analysis on the Ks-band light curves from the VVV Infrared Astrometric v2 Catalogue (VIRAC2, Smith et al. 2025) for five objects identified in the VVV catalog, which have been suggested as blazar candidates: RS17 (J1745.6-3626), RS23 (J1814.7-3420), RS24 (J1816.4-2727), RS25 (J1817.2-3035), and RS33 (J1828.2-3252). The VIRAC2 is a PSF-based catalog that uses Ks-band epochs from the VVV and VVV eXtended Surveys (Saito et al. 2024), covering a time baseline of approximately 13 years. Using the available photometric data in this band, the corresponding light curves were constructed for each source. Figure 7 plots the Ks magnitude as a function of time for the five blazars candidates. To quantify and assess the significance of the flux variations in our sample, we employed a triple-criterion approach using complementary statistical estimators: the fractional variability amplitude (Fvar), the reduced chi-squared (χred2), and the Kolmogorov-Smirnov (K–S) test.
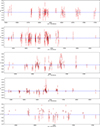 |
Fig. 7. Ks-band light-curves for five blazar candidates. The graphics correspond from top to bottom to RS17 (J1745.6-3626), RS23 (J1814.7-3420), RS24 (J1816.4-2727), RS25 (J1817.2-3035), and RS33 (J1828.2-3252). The error bars are shown in red, and the mean value is represented by the blue dashed line. |
The fractional variability amplitude was calculated following the prescription of Vaughan et al. (2003):
 (1)
(1)
where S2 is the total variance, ⟨σerr2⟩ is the mean square of the measurement uncertainties, and ⟨x⟩ is the mean magnitude.
While Fvar provides a direct measure of the physical magnitude of the fluctuations, we used χred2 and the K–S test to establish statistical significance from different perspectives. The reduced chi-squared (χred2 = χ2/d.o.f., where d.o.f. is the degrees of freedom) evaluates the overall goodness of fit against a constant model and is sensitive to total data dispersion. In parallel, the K-S test assesses the probability (p value) of the observed magnitude distribution deviating from a normal distribution expected from purely stochastic noise.
To ensure the reliability of our detections against instrumental systematics and the intrinsic stochastic nature of astronomical sources, we performed a significance test based on red noise simulations. We modeled the background fluctuations using a damped random walk (DRW) process, which is characterized by a power spectral density of P(f) ∝ f−2 at high frequencies. This model offers a more accurate depiction of astrophysical variability compared to white-noise models.
Implementing the DRW model and subsequent significance thresholds required refined data quality control. Consequently, the final number of points (Npts) for each source was adjusted to ensure reliable temporal sampling. This process involved removing outliers and observations whose uncertainties significantly exceeded the sample mean. This ensured that the variability analysis would not be affected by poor-quality data or uncorrelated noise.
For each source, we generated 10 000 synthetic light curves that replicate the exact observational cadence (MJD) and the mean measurement uncertainties of the real data. These simulations allowed us to determine a conservative confidence threshold; that is, a source is considered genuinely variable only if its observed Fvar and  exceed 99% of the distribution generated by these red-noise trajectories.
The results for the five analyzed sources are summarized in Table 3. Furthermore, we ran a Stetson algorithm (Stetson 1996) and identified all of them as potential variable sources (JS > 0.5).
Summary of variability analysis.
3.3. Radio data
We used radio observations from the Rapid ASKAP Continuum Survey (RACS, McConnell et al. 2020), conducted with the Australian Square Kilometre Array Pathfinder (ASKAP) telescope, in the 700–1800 MHz frequency range. The RACS survey covered the entire sky visible from the ASKAP site in the southern hemisphere, with declinations ranging from −90° to +51°. We created cutouts2 around the coordinates of five blazar candidates using image data sets from three RACS bands (Duchesne et al. 2025): 887.5 MHz with a bandwidth of 288 MHz (RACS-low), 1295.5 MHz with a bandwidth of 144 MHz (RACS-mid), and 1655.5 MHz with a bandwidth of 288 MHz (RACS-high). RACS can reach sensitivities of 0.25 mJy/beam with resolutions of 25″ (RACS-low), and 0.2 mJy/beam with resolutions of ∼9.5″ (RACS-mid and -high).
We fit a 2D gaussian profile (Condon 1997) to estimate the total flux density for each band and created SED profiles for these bands (Fig. 8). To compare the profiles, in Fig. 9 we show the normalized fluxes. The SED modeling does not account for intrinsic variability. RACS-low was conducted in separate campaigns from April 2019 to mid-2020, and RACS-mid was conducted in a later epoch. We emphasize that different epochs can affect the interpretation of blazar spectra. However, the SEDs of four blazar candidates show a secondary low-frequency turn-up νtrough − rest higher than the mean value of 1 GHz found by Behiri et al. (2025) in the characterization of the blazar SEDs.
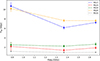 |
Fig. 8. Spectral energy distributions for five blazar candidates (RS) shown at 887.5 MHz (RACS-low), 1295.5 MHz (RACS-mid), and 1655.5 MHz (RACS-high), with error bars. |
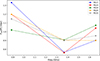 |
Fig. 9. Spectral energy distributions with normalized fluxes for five blazar candidates (RS) shown at 887.5 MHz (RACS-low), 1295.5 MHz (RACS-mid), and 1655.5 MHz (RACS-high). |
4. Results
4.1. UGS J1745.6-3626
contains three sources within the 95% confidence Fermi error ellipse. Two of these sources, RS15 and RS16, are separated by about 10″. One of them was reported as a multi-Gaussian fit in the VLASS catalog. Recently, Stein et al. (2021) modeled an SED and obtained a spectral index of α = −0.95 at frequencies of 150 MHz, 842 MHz, and 1.4 GHz using observations from the TIFR GMRT Sky Survey Alternative Data Release (TGSS ADR, Intema et al. 2017), the Molonglo Galactic Plane Survey (MGPS, Murphy et al. 2007), and the NRAO VLA Sky Survey (NVSS, Condon et al. 1998), respectively. We also applied our CMDs and CCD analysis to the NIR source near to RS15 and RS16, but the results were negative. The third source, RS17, has an NIR source at 1.02″ that meets the CCD and variability criteria for a blazar candidate (Fig. A.1). Nevertheless, RS17 was classified as a marginal candidate under the stringent criteria imposed by the red-noise simulations. Although it shows slight deviations from a constant model, its fluctuation amplitude is consistent with the tail of the simulated red noise distribution. Therefore, we adopted a conservative interpretation, acknowledging that a combination of low-level intrinsic activity and residual instrumental effects could explain the observed behavior.
4.2. UGS J1814.7-3420
only contains the radio source VLASS1QLCIR J181446.75-342340.7 (RS23), which lies within the 95% confidence Fermi error ellipse. RS23 has an integrated flux of 1.562 ± 0.209 mJy at the S band. This radio source has a nearby NIR source located in the CCD region labeled B (Fig. A.2), which is separated by 0.63″. This NIR source exhibits relative stability in red-noise simulations, with variations primarily driven by measurement noise.
4.3. UGS J1816.4-2727
has a radio source, VLASS1QLCIR J181628.79-272602.8 (RS24), for which Schinzel et al. (2017) follow-up observations were performed using the Australia Telescope Compact Array (ATCA) and the JVLA within the 4 − 10 GHz range. They determined the flux density at two frequencies with a 2 GHz bandwidth: 4.2 ± 0.2 mJy at 5.5 GHz and 4.5 ± 0.4 mJy at 9 GHz. This resulted in a spectral index of α = 0.14. Bruzewski et al. (2021) used dedicated VLA observations at the C-band receiver (4 − 8 GHz) and combined them with data from the VLASS catalog at the S band. They obtained integrated fluxes of 3.250 ± 0.225 mJy (3 GHz), 2.100 ± 0.0992 mJy (5 GHz), and 3.820 ± 0.2060 mJy (7 GHz), as well as a spectral index of α = 0.261 ± 0.120 using the integrated flux values at three frequencies. There are two NIR sources near RS24, but the closer one (0.36″) is near the edge of the CCD region labeled B (Fig. A.3). This NIR source meets the color-color criteria of Baravalle et al. (2023) and was identified as variable using red-noise simulations. This object is a high-priority candidate for follow-up observations to characterize its physical nature due to the combination of high fractional variability and a low p value.
4.4. For UGS J1817.2-3035,
Donoso et al. (2024) found four NIR sources, two of which are located in the A region and two in the B region of the CCD (Fig. A.4). They proposed a VVV object (coordinates RA = 18 : 17 : 20.41 and Dec = − 30 : 32 : 58.90) as an early-type galaxy candidate for the UGS counterpart. We only found a radio source, VLASS1QLCIR J181720.39-303258.5 (RS25), with an integrated flux of 5.802 ± 0.221 mJy at the S band. Schinzel et al. (2017) determined integrated fluxes 6.0 ± 0.2 mJy at 5.5 GHz and 5.7 ± 0.2 mJy at 9 GHz, resulting in a spectral index of α = −0.1. The RS25 is located at a distance of 0.44″ from the proposed NIR source by Donoso et al. (2024). Its fractional variability amplitude (Fvar) is less than 0.5, and its magnitude distribution is statistically consistent with a constant model (K-S p−value > 0.3). Additionally, RS25 is relatively stable in red-noise simulations, with variations primarily attributed to measurement noise.
4.5. For UGS J1828.2-3252,
there are two radio sources within the 95% confidence Fermi error ellipse. The VLASS catalog duplicated detections from each source. Two different flux values have been measured for RS33 at 3 GHz: 11.129 ± 0.943 mJy (multi-Gaussian fit, Duplicate_flag = 1) and 7.862 ± 0.519 mJy (single-Gaussian fit, Duplicate_flag = 2). Bruzewski et al. (2021) observed this source with the VLA in the C band and obtained integrated fluxes of 2.860 ± 0.119 mJy at 5 GHz and 3.130 ± 0.225 mJy at 7 GHz. However, they considered the the target with a single-Gaussian fit (VLASS1QLCIR J182817.06-325520.5) and flux of 7.862 ± 0.519 mJy at 3 GHz to estimate a spectral index of α = −1.552 ± 0.403. We chose the target with a multi-Gaussian fit, VLASS1QLCIR J182817.08-325520.5 and higher flux. The RS33 NIR source, located at 0.36″, meets the CCD criteria (Fig. A.5) and exhibits the strongest evidence of intrinsic variability. It has a high  of 1.59, a significant fractional amplitude of 3.41%, and a K-S p value of 0.0001, which is inconsistent with stochastic fluctuations (p < 0.01). In this specific case, the sample size was optimized to 142 points by including high-cadence intraday observations. This increased density is essential for accurately determining the damping timescale (τ) using the DRW model. It also ensures that the higher Fvar observed is not due to sparse sampling. Using the JHKs-bands of VVV and the optical images from the DECam Plane Survey (DECaPS2, Saydjari et al. 2022), we found visual evidence of a diffuse object, consistent with the presence of an elliptical galaxy.
5. Conclusions
From an initial sample of 318 UGSs, we selected 22 targets that had at least one detected continuum radio source in the S band of the VLASS catalog and were located within the 95% confidence Fermi error ellipse. The 22 targets had a total of 34 RSs. Only five RSs were associated with an NIR source from the VVV survey that meets the CMD and CCD criteria and shows variability. We propose the following four NIR sources as blazar candidates for the UGSs: J1745.6-3626, J1814.7-3420, J1816.4-2727, and J1817.2-3035. We found evidence indicating that J1828.2-3252 is consistent with an elliptical galaxy undergoing a merging process.
In Table 1, RS01 and RS08 are shown, which were previously classified as planetary nebulae. We did not find evidence of an extragalactic source for these objects in the CMD and CCD analyses, even though the central star of a planetary nebula can be detected in the NIR (see Minniti et al. 2025). To determine the origin of these UGSs (J1714.9-3324 and J1737.2-2808, respectively), more observations are needed.
We achieved a robust characterization of the five sources in our sample through statistical analysis of variability, which was reinforced by red-noise simulations. Using a multi-method approach, we confirmed that UGS J1816.4-2727 and UGS J1828.2-3252 exhibit significant intrinsic variability. The most robust results were found in UGS J1828.2-3252, where all statistical criteria were met: a high χred2 (1.59), a significant fractional amplitude (3.41%), and a K–S p value (0.0001) well below the significance threshold. This consistency provided high confidence in the astrophysical nature of the detected fluctuations for these two sources. Regarding the sources with lower variability amplitudes, such as UGS J1745.6-3626, we took a more cautious approach to interpretation. Although this source exhibits slight deviations from stability, our DRW simulations suggest that these fluctuations are not sufficiently decoupled from the expected stochastic background. We emphasize that, in the regime of Fvar ≲ 1.5%, the potential impact of residual instrumental systematics and correlated noise becomes non-negligible. While these objects are still of interest, their classification as genuinely variable is currently limited by the available photometric sampling. Further high-cadence monitoring and improved sensitivity are therefore essential for definitively distinguishing low-level, intrinsic astrophysical signals from complex instrumental noise.
Particularly, the blazar candidates for UGS J1745.6-3626, 1814.7-3420, 1816.4-2727, and J1828.2-3252 exhibit a peaked SED with a secondary low-frequency turn-up νtrough − rest between 0.9 and 1.3 GHz. This can be explained by the fact that the spectrum of the central region dominates the broad, pronounced component on a kiloparsec scale (see Edwards & Tingay 2004). This results in an overall spectrum that rises at low frequencies. The blazar candidate for UGS J1817.2-3035 (RS26) does not exhibit a low-frequency turn-up in the RACS wavelength range. However, it can be described by a simple power-law model, Sν ∝ ν−0.1, by using the spectral index determined in Schinzel et al. (2017). Future work dedicated to observing these five blazar candidates at radio continuum frequencies higher than 1.6 GHz will help determine their turnover peak frequencies, νp, which are evidence of synchrotron self-absorption. The spectral index ratio of the optically thin and thick components, αthick (ν < νp) and αthin (ν > νp), respectively, could be used as a proxy for the blazar population of FSRQs and BL Lacs.
Acknowledgments
This paper was partially supported by the National Scientific and Technical Research Council (CONICET), as well as by the CICITCA grant (code 80020220100090SJ) for the period 2023–2024. This work has made used of data from the fourth Fermi Large Area Telescope Data Release 3, the Very Large Array Sky Survey, the VISTA Variables in the Via Lactea Survey, and the Rapid ASKAP Continuum Survey. R.K.S. acknowledges support from CNPq/Brazil through projects 308298/2022-5 and 421034/2023-8. D.M. acknowledges support by ANID Fondecyt Regular grant No. 1220724, and by the BASAL Center for Astrophysics and Associated Tecnologies (CATA) through ANID grant FB210003.
References
- Acero, F., Donato, D., Ojha, R., et al. 2013, ApJ, 779, 133 [Google Scholar]
- Ackermann, M., Ajello, M., Allafort, A., Antolini, E., & Baldini, L. 2012, ApJ, 753, 83 [NASA ADS] [CrossRef] [Google Scholar]
- Ajello, M., Angioni, R., Axelsson, M.et al. 2020, ApJ, 892, 105 [NASA ADS] [CrossRef] [Google Scholar]
- Atwood, W. B., Abdo, A. A., Ackermann, M., et al. 2009, ApJ, 697, 1071 [CrossRef] [Google Scholar]
- Ballet, J., et al. (The Fermi-LAT collaboration) 2023, ArXiv e-prints [arXiv:2307.12546] [Google Scholar]
- Baravalle, L. D., Schmidt, E. O., Alonso, M. V., et al. 2023, MNRAS, 520, 5950 [Google Scholar]
- Behiri, M., Mahony, E. K., Sadler, E., et al. 2025, A&A, 702, A10 [NASA ADS] [CrossRef] [EDP Sciences] [Google Scholar]
- Blandford, R. D., & Königl, A. 1979, ApJ, 232, 34 [Google Scholar]
- Bruzewski, S., Schinzel, F. K., Taylor, G. B., & Petrov, L. 2021, ApJ, 914, 42 [NASA ADS] [CrossRef] [Google Scholar]
- Catelan, M., Minniti, D., Lucas, P. W., et al. 2011, in RR Lyrae Stars, Metal-Poor Stars, and the Galaxy, ed. A. McWilliam, 5, 145 [NASA ADS] [Google Scholar]
- Cavaliere, A., & D’Elia, V. 2002, ApJ, 571, 226 [NASA ADS] [CrossRef] [Google Scholar]
- Chen, Z., Gu, M., & Cao, X. 2009, MNRAS, 397, 1713 [NASA ADS] [CrossRef] [Google Scholar]
- Cioni, M.-R., Clementini, G., Girardi, L., Guandalini, R., & Gullieuszik, M. 2011, The Messenger, 144, 25 [NASA ADS] [Google Scholar]
- Cioni, M.-R. L., Kamath, D., Rubele, S., et al. 2013, A&A, 549, A29 [NASA ADS] [CrossRef] [EDP Sciences] [Google Scholar]
- Condon, J. J. 1997, PASP, 109, 166 [NASA ADS] [CrossRef] [Google Scholar]
- Condon, J. J., Cotton, W. D., Greisen, E. W., et al. 1998, AJ, 115, 1693 [Google Scholar]
- D’Abrusco, R., Álvarez Crespo, N., Massaro, F., et al. 2019, ApJS, 242, 4 [Google Scholar]
- Donoso, L. G., Pichel, A., Baravalle, L. D., et al. 2024, MNRAS, 529, 1019 [Google Scholar]
- Duchesne, S., Ross, K., Thomson, A. J. M., et al. 2025, PASA, 42, 38 [Google Scholar]
- Edwards, P. G., & Tingay, S. J. 2004, A&A, 424, 91 [NASA ADS] [CrossRef] [EDP Sciences] [Google Scholar]
- Fossati, G., Maraschi, L., Celotti, A., Comastri, A., & Ghisellini, G. 1998, MNRAS, 299, 433 [Google Scholar]
- Frew, D. J., Bojičić, I. S., & Parker, Q. A. 2013, MNRAS, 431, 2 [NASA ADS] [CrossRef] [Google Scholar]
- Gordon, Y. A., Boyce, M. M., O’Dea, C. P., et al. 2021, ApJS, 255, 30 [NASA ADS] [CrossRef] [Google Scholar]
- Intema, H. T., Jagannathan, P., Mooley, K. P., & Frail, D. A. 2017, A&A, 598, A78 [NASA ADS] [CrossRef] [EDP Sciences] [Google Scholar]
- Jacoby, G. H., Hillwig, T. C., Jones, D., et al. 2021, MNRAS, 506, 5223 [NASA ADS] [CrossRef] [Google Scholar]
- Kuhn, M. A., de Souza, R. S., Krone-Martins, A., et al. 2021, ApJS, 254, 33 [NASA ADS] [CrossRef] [Google Scholar]
- Lefaucheur, J., & Pita, S. 2017, A&A, 602, A86 [NASA ADS] [CrossRef] [EDP Sciences] [Google Scholar]
- Lister, M. L., Homan, D. C., Hovatta, T., & Kellermann, K. I. 2019, ApJ, 874, 43 [NASA ADS] [CrossRef] [Google Scholar]
- Marchesini, E. J., Paggi, A., Massaro, F., et al. 2019, A&A, 631, A150 [NASA ADS] [CrossRef] [EDP Sciences] [Google Scholar]
- Marchesini, E. J., Reynaldi, V., Vieyro, F., et al. 2023, A&A, 670, A91 [NASA ADS] [CrossRef] [EDP Sciences] [Google Scholar]
- Massardi, M., Bonaldi, A., Bonavera, L., et al. 2016, MNRAS, 455, 3249 [Google Scholar]
- Massaro, E., Maselli, A., Leto, C., et al. 2015, Ap&SS, 357, 75 [Google Scholar]
- Massaro, F., D’Abrusco, R., Ajello, M., Grindlay, J. E., & Smith, H. A. 2011, ApJ, 740, L48 [NASA ADS] [CrossRef] [Google Scholar]
- Massaro, F., D’Abrusco, R., Giroletti, M., et al. 2013, ApJS, 207, 4 [Google Scholar]
- Massaro, F., D’Abrusco, R., Tosti, G., et al. 2012a, ApJ, 750, 138 [NASA ADS] [CrossRef] [Google Scholar]
- Massaro, F., D’Abrusco, R., Tosti, G., et al. 2012b, ApJ, 752, 61 [NASA ADS] [CrossRef] [Google Scholar]
- McConnell, D., Hale, C. L., Lenc, E., et al. 2020, PASA, 37, e048 [Google Scholar]
- Minniti, D., Fragkou, V., Alonso-García, J., Majaess, D., & Cortesi, A. 2025, A&A, 702, A79 [NASA ADS] [CrossRef] [EDP Sciences] [Google Scholar]
- Minniti, D., Lucas, P. W., Emerson, J. P., & Saito, R. K. 2010, New Astron., 15, 433 [NASA ADS] [CrossRef] [Google Scholar]
- Mohan, N., & Rafferty, D. 2015, Astrophysics Source Code Library [record ascl:1502.007] [Google Scholar]
- Murphy, T., Mauch, T., Green, A., et al. 2007, MNRAS, 382, 382 [Google Scholar]
- Padovani, P., Alexander, D. M., Assef, R. J., et al. 2017, A&ARv, 25, 2 [Google Scholar]
- Paggi, A., Massaro, F., D’Abrusco, R., et al. 2013, ApJS, 209, 9 [NASA ADS] [CrossRef] [Google Scholar]
- Paiano, S., Falomo, R., Treves, A., & Scarpa, R. 2020, MNRAS, 497, 94 [CrossRef] [Google Scholar]
- Peirson, A. L., Liodakis, I., & Romani, R. W. 2022, ApJ, 931, 59 [CrossRef] [Google Scholar]
- Pichel, A., Donoso, L. G., Baravalle, L. D., et al. 2020, MNRAS, 491, 3448 [Google Scholar]
- Saito, R. K., Hempel, M., Alonso-García, J., et al. 2024, A&A, 689, A148 [NASA ADS] [CrossRef] [EDP Sciences] [Google Scholar]
- Saydjari, A., Schlafly, E., Lang, D., et al. 2022, Am. Astron. Soc. Meet. Abstr., 240, 318.06 [Google Scholar]
- Schinzel, F. K., Petrov, L., Taylor, G. B., & Edwards, P. G. 2017, ApJ, 838, 139 [CrossRef] [Google Scholar]
- Schlafly, E. F., & Finkbeiner, D. P. 2011, ApJ, 737, 103 [Google Scholar]
- Schmidt, E. O., Baravalle, L. D., Pichel, A., et al. 2025, MNRAS, 544, 152 [Google Scholar]
- Smith, L. C., Lucas, P. W., Koposov, S. E., et al. 2025, MNRAS, 536, 3707 [NASA ADS] [CrossRef] [Google Scholar]
- Stein, Y., Vollmer, B., Boch, T., et al. 2021, A&A, 655, A17 [NASA ADS] [CrossRef] [EDP Sciences] [Google Scholar]
- Stetson, P. B. 1996, PASP, 108, 851 [NASA ADS] [CrossRef] [Google Scholar]
- Stickel, M., Padovani, P., Urry, C. M., Fried, J. W., & Kuehr, H. 1991, ApJ, 374, 431 [Google Scholar]
- Urry, C. M., & Padovani, P. 1995, PASP, 107, 803 [NASA ADS] [CrossRef] [Google Scholar]
- Vaughan, S., Edelson, R., Warwick, R. S., & Uttley, P. 2003, MNRAS, 345, 1271 [Google Scholar]
- Wright, E. L., Eisenhardt, P. R. M., Mainzer, A. K., & Ressler, M. E. 2010, AJ, 140, 1868 [NASA ADS] [CrossRef] [Google Scholar]
- Yang, J. H., Fan, J. H., Liu, Y., et al. 2022, ApJS, 262, 18 [Google Scholar]
The VVV photometry was obtained from http://vsa.roe.ac.uk/.
The RACS cutouts were obtained from the public domain https://data.csiro.au/.
Appendix A: CMD and CCD
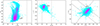 |
Fig. A.1. Color-magnitude diagrams (CMDs) and color-color diagram (CCD) of the YJHKS passbands for blazar candidates. The source VVV-J174555.13-362331.2 (RS17) is marked with a black circle. The magenta-cyan color map corresponds to the density of VVV objects lying within the positional uncertainty region of the UGS. In the CMDs, the dashed gray lines correspond to the color criteria of Baravalle et al. (2023). For the CCD, the solid gray lines and labeled regions are defined by Cioni et al. (2013). |
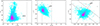 |
Fig. A.2. CMD and CCDs of the YJHKS passbands for the source VVV-J181446.75-342341.3 (RS23). |
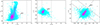 |
Fig. A.3. CMD and CCDs of the YJHKS passbands for the source VVV-J181628.80-272603.1 (RS24). |
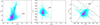 |
Fig. A.4. CMD and CCDs of the YJHKS passbands for the source VVV-J181720.40-303300.0 (RS25). |
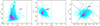 |
Fig. A.5. CMD and CCDs of the YJHKS passbands for the source VVV-J182817.04-325521.0 (RS33). |
All Tables
List of five NIR sources that could be extragalactic sources associated with UGS.
All Figures
|
Fig. 1. Histogram of separation between the confirmed blazars in the Roma-BZCAT catalog and the nearby continuum radio source in the VLASS catalog, expressed in arcsec. |
| In the text | |
|
Fig. 2. VVV image in Ks band of RS17 (UGS J1745.6-3626). Green lines show the contour levels of the VLASS J174555.05-362331.3 source. |
| In the text | |
|
Fig. 3. VVV image in Ks band of RS23 (UGS J1814.7-3420). Green lines show the contour levels of the VLASS J181446.75-342340.7 source. |
| In the text | |
|
Fig. 4. VVV image in Ks band of RS24 (UGS J1816.4-2727). Green lines show the contour levels of the VLASS J181628.79-272602.8 source. |
| In the text | |
|
Fig. 5. VVV image in Ks band of RS25 (UGS J1817.2-3035). Green lines show the contour levels of the VLASS J181720.39-303258.5 source. |
| In the text | |
|
Fig. 6. VVV image in Ks band of RS33 (UGS J1828.2-3252). Green lines show the contour levels of the VLASS J182817.08-325520.5 source. |
| In the text | |
|
Fig. 7. Ks-band light-curves for five blazar candidates. The graphics correspond from top to bottom to RS17 (J1745.6-3626), RS23 (J1814.7-3420), RS24 (J1816.4-2727), RS25 (J1817.2-3035), and RS33 (J1828.2-3252). The error bars are shown in red, and the mean value is represented by the blue dashed line. |
| In the text | |
|
Fig. 8. Spectral energy distributions for five blazar candidates (RS) shown at 887.5 MHz (RACS-low), 1295.5 MHz (RACS-mid), and 1655.5 MHz (RACS-high), with error bars. |
| In the text | |
|
Fig. 9. Spectral energy distributions with normalized fluxes for five blazar candidates (RS) shown at 887.5 MHz (RACS-low), 1295.5 MHz (RACS-mid), and 1655.5 MHz (RACS-high). |
| In the text | |
|
Fig. A.1. Color-magnitude diagrams (CMDs) and color-color diagram (CCD) of the YJHKS passbands for blazar candidates. The source VVV-J174555.13-362331.2 (RS17) is marked with a black circle. The magenta-cyan color map corresponds to the density of VVV objects lying within the positional uncertainty region of the UGS. In the CMDs, the dashed gray lines correspond to the color criteria of Baravalle et al. (2023). For the CCD, the solid gray lines and labeled regions are defined by Cioni et al. (2013). |
| In the text | |
|
Fig. A.2. CMD and CCDs of the YJHKS passbands for the source VVV-J181446.75-342341.3 (RS23). |
| In the text | |
|
Fig. A.3. CMD and CCDs of the YJHKS passbands for the source VVV-J181628.80-272603.1 (RS24). |
| In the text | |
|
Fig. A.4. CMD and CCDs of the YJHKS passbands for the source VVV-J181720.40-303300.0 (RS25). |
| In the text | |
|
Fig. A.5. CMD and CCDs of the YJHKS passbands for the source VVV-J182817.04-325521.0 (RS33). |
| In the text | |
Current usage metrics show cumulative count of Article Views (full-text article views including HTML views, PDF and ePub downloads, according to the available data) and Abstracts Views on Vision4Press platform.
Data correspond to usage on the plateform after 2015. The current usage metrics is available 48-96 hours after online publication and is updated daily on week days.
Initial download of the metrics may take a while.