Fig. 14
Download original image
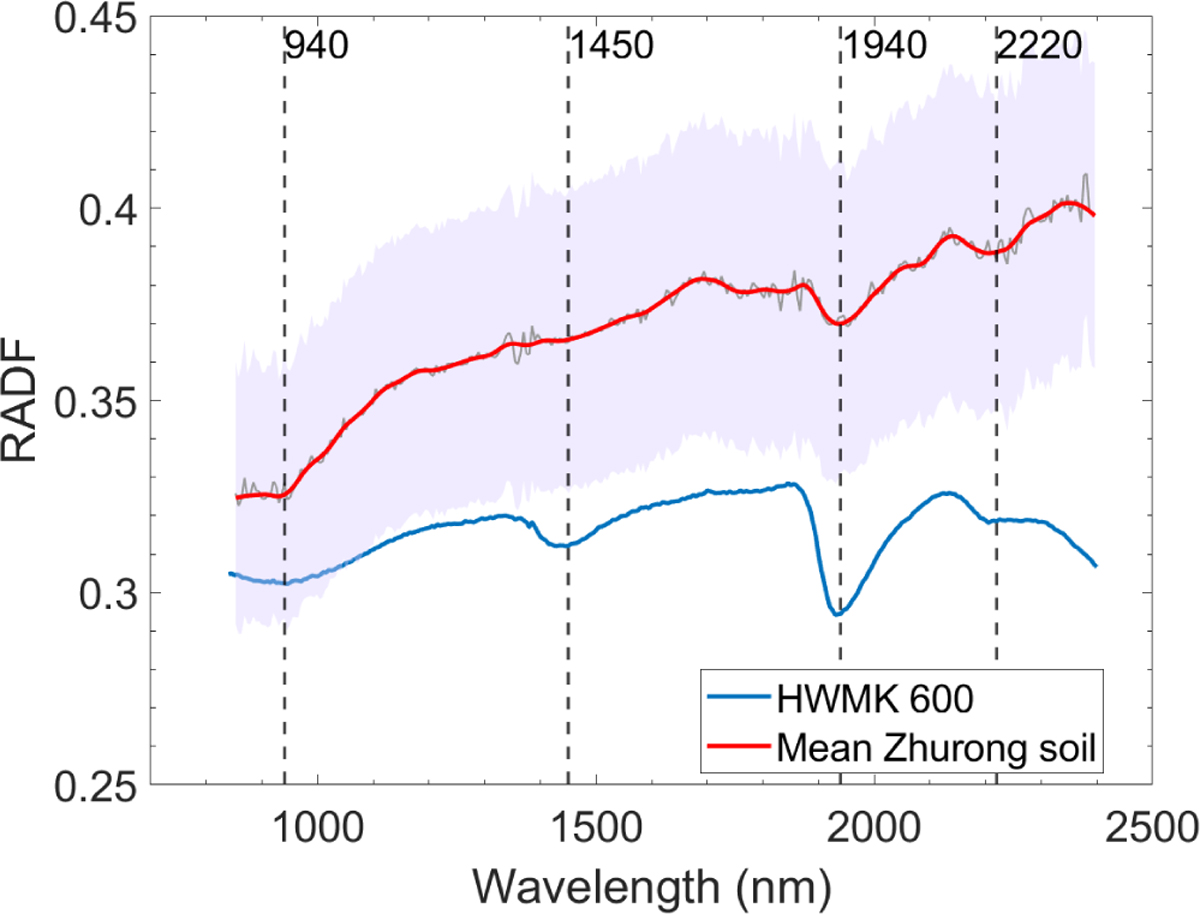
Comparison between the mean soil spectrum at the Zhurong landing site and the HWMK 600 spectrum. The red line represents the mean soil spectrum acquired by Zhurong (smoothed and photometrically corrected to i = 30° and e = 0°). The gray line denotes the unsmoothed spectra, while the shaded area indicates one standard deviation. The blue line corresponds to the HWMK 600 spectrum (RELAB ID: capa03, grain size 0–45 μm), converted to RADF by dividing by cos 30°.
Current usage metrics show cumulative count of Article Views (full-text article views including HTML views, PDF and ePub downloads, according to the available data) and Abstracts Views on Vision4Press platform.
Data correspond to usage on the plateform after 2015. The current usage metrics is available 48-96 hours after online publication and is updated daily on week days.
Initial download of the metrics may take a while.