Open Access
Fig. B.6
Download original image
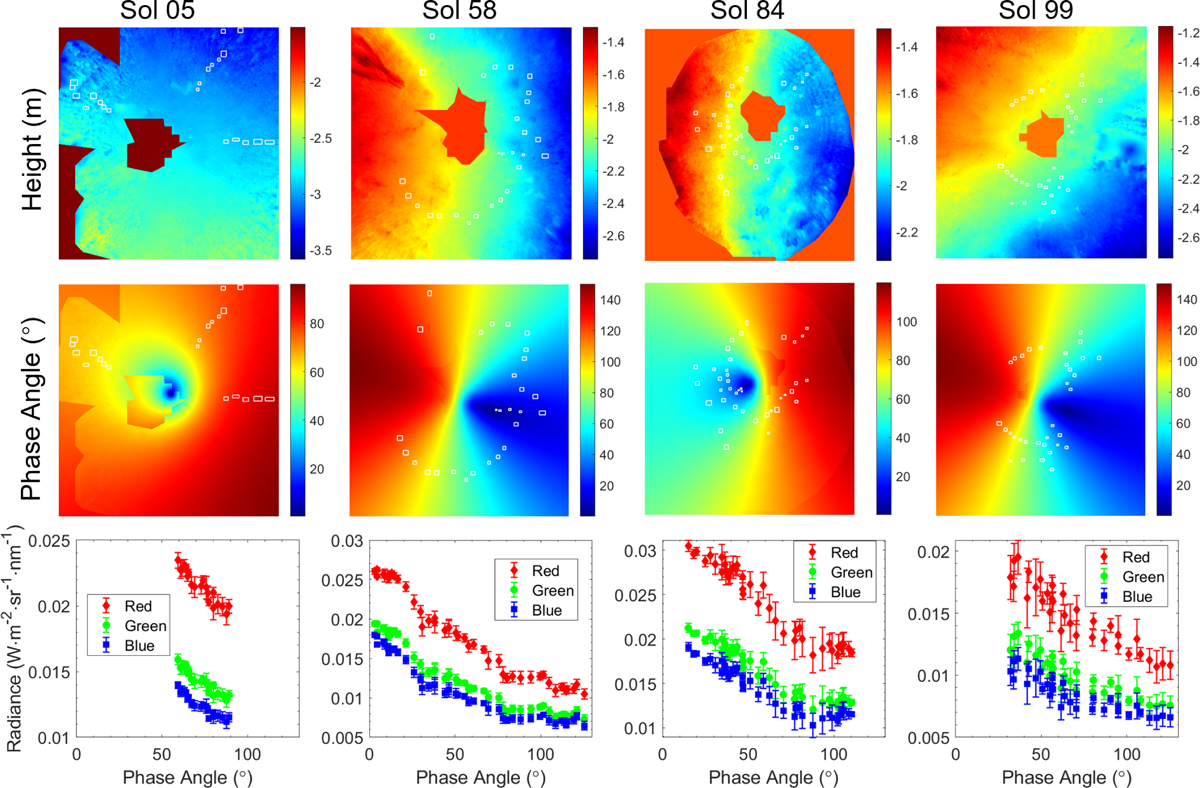
Digital Elevation Model (DEM, top), phase angle distributions (middle), and extracted phase curves (bottom) for Sols 05, 58, 84, and 99. White boxes in the top and middle panels indicate the ROIs corresponding to the phase curves shown in the bottom panel.
Current usage metrics show cumulative count of Article Views (full-text article views including HTML views, PDF and ePub downloads, according to the available data) and Abstracts Views on Vision4Press platform.
Data correspond to usage on the plateform after 2015. The current usage metrics is available 48-96 hours after online publication and is updated daily on week days.
Initial download of the metrics may take a while.