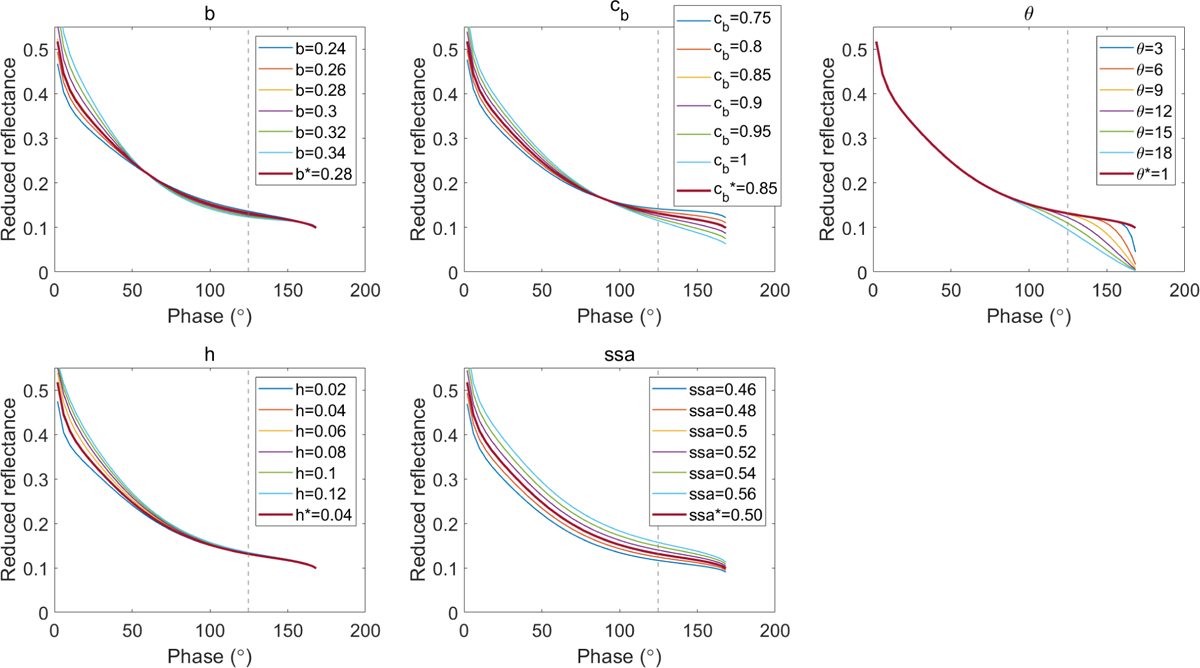
Fig. C.1
Download original image
Influence of individual photometric parameters on the phase curves. The asterisk in the legend denotes the best-fit solution retrieved for the Sol 32 R band. Panels (a–e) show simulations in which only one parameter is varied at a time while all other parameters are fixed at their best-fit values. The vertical dashed line indicates the maximum observed phase angle for Sol 32; phase angles to the left correspond to the measured range, whereas those to the right represent the extrapolated range.
Current usage metrics show cumulative count of Article Views (full-text article views including HTML views, PDF and ePub downloads, according to the available data) and Abstracts Views on Vision4Press platform.
Data correspond to usage on the plateform after 2015. The current usage metrics is available 48-96 hours after online publication and is updated daily on week days.
Initial download of the metrics may take a while.