Open Access
Fig. 3
Download original image
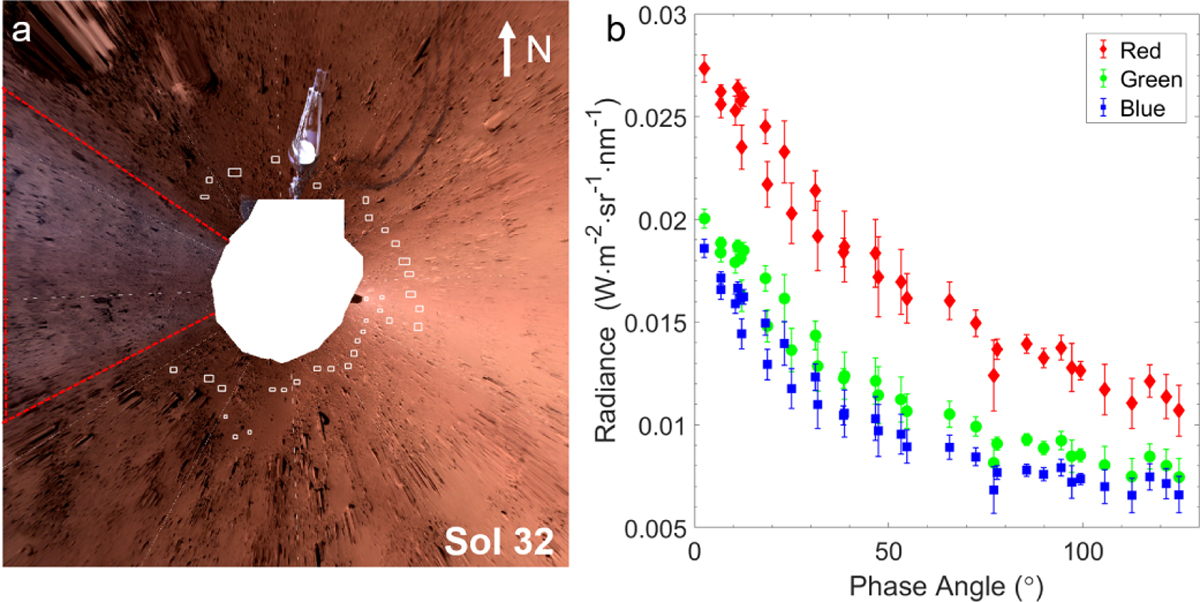
DOMs and extracted phase curves of Sol 32. (a) DOMs for Sols 32. The white dashed lines indicate the boundaries of the mosaicking, and the white boxes mark the selected ROIs. The red dashed line encloses the area affected by reflections from the rover’s coating. (b) The corresponding phase curves extracted from the ROIs.
Current usage metrics show cumulative count of Article Views (full-text article views including HTML views, PDF and ePub downloads, according to the available data) and Abstracts Views on Vision4Press platform.
Data correspond to usage on the plateform after 2015. The current usage metrics is available 48-96 hours after online publication and is updated daily on week days.
Initial download of the metrics may take a while.