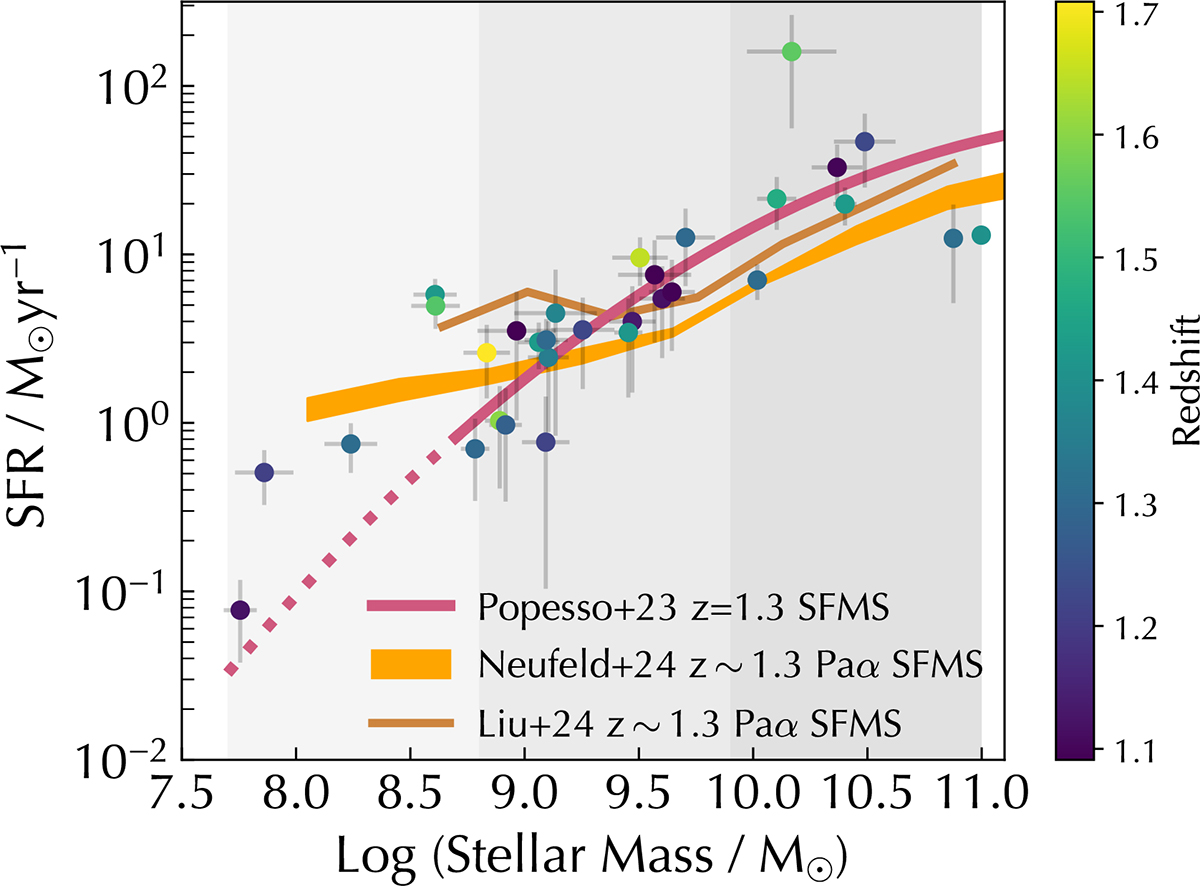
Fig. 2.
Download original image
SFMS of our sample measured using SED fitting (see Section 2.4). The shaded grey regions delineate our stellar mass bins for the stacking analysis. SFRs and the Popesso et al. (2023) SFMS include dust corrections. The dotted line indicates extrapolation. The brown line and orange region delineate the FRESCO Paα SFMS from Liu et al. (2026) and Neufeld et al. (2024), respectively.
Current usage metrics show cumulative count of Article Views (full-text article views including HTML views, PDF and ePub downloads, according to the available data) and Abstracts Views on Vision4Press platform.
Data correspond to usage on the plateform after 2015. The current usage metrics is available 48-96 hours after online publication and is updated daily on week days.
Initial download of the metrics may take a while.