Fig. 4.
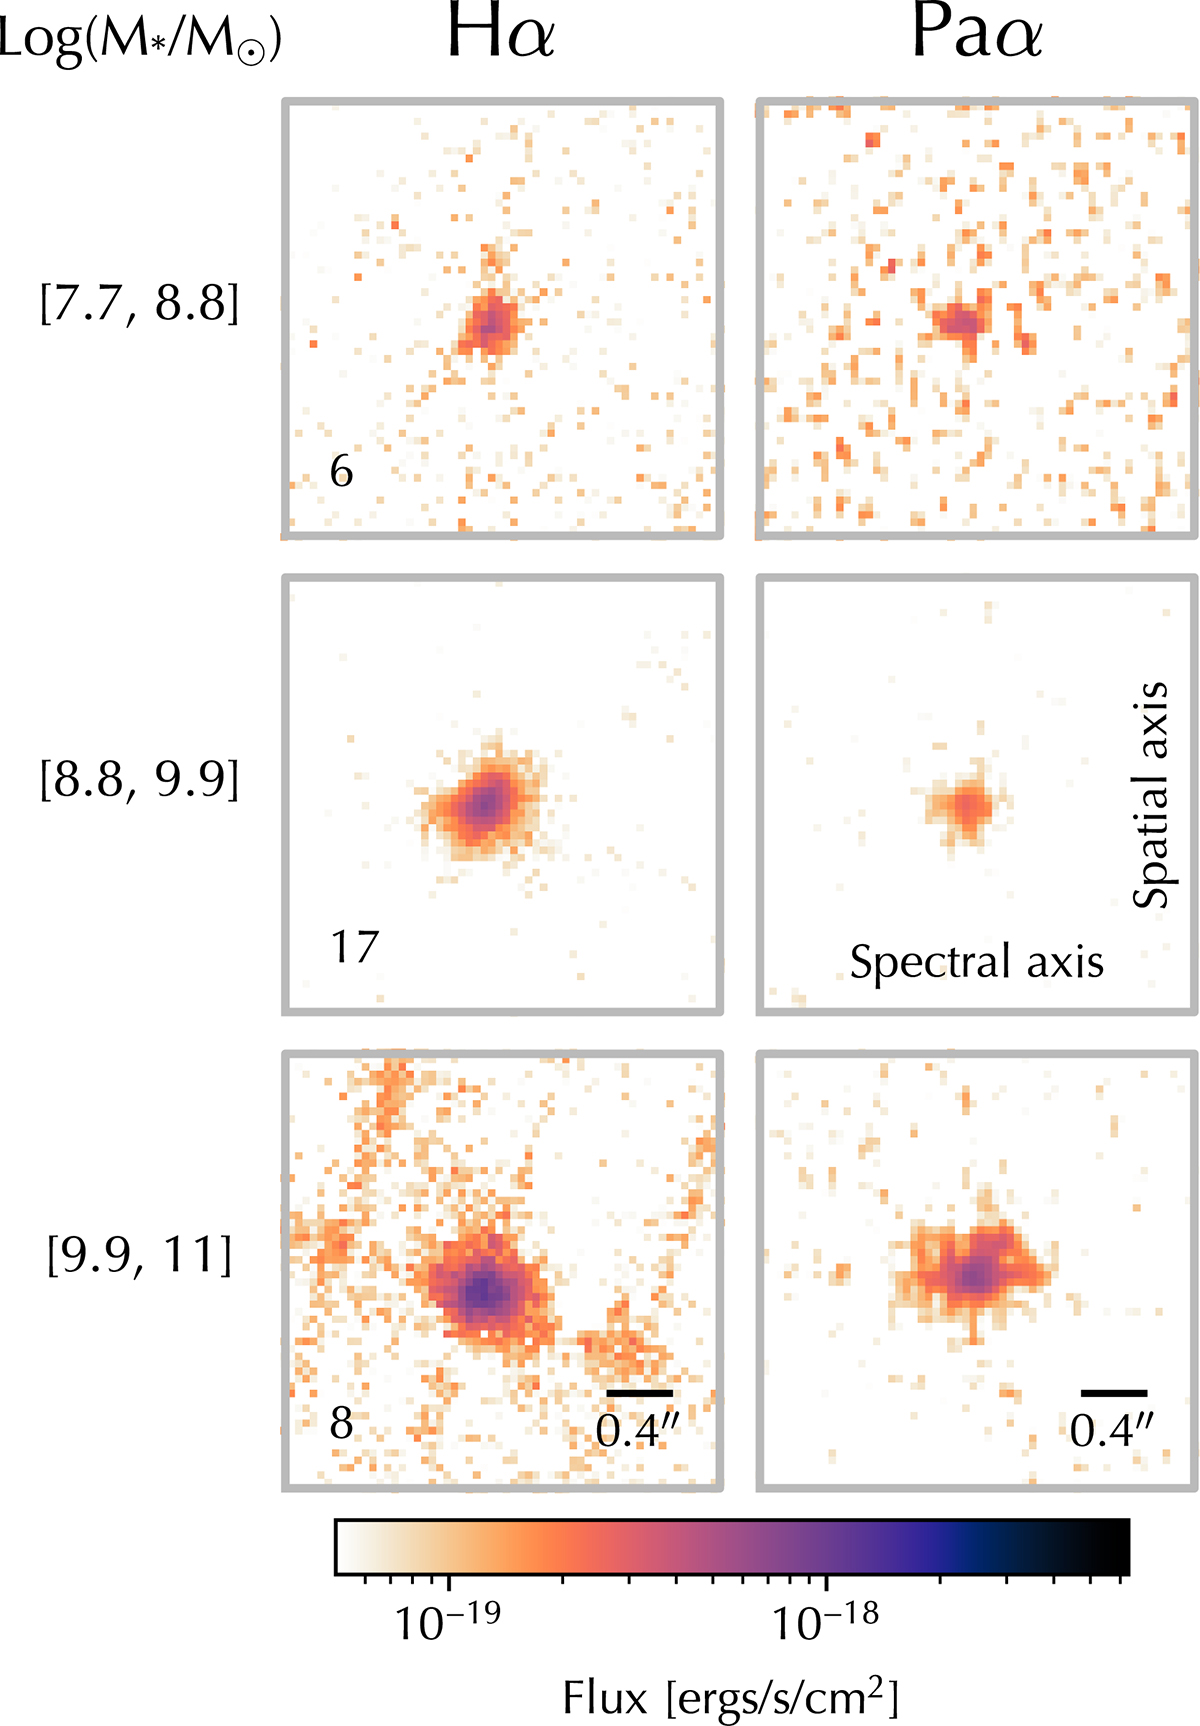
Download original image
Hα (first column) and Paα-to-NGDEEP convolved (second column) stacks for our sample in three stellar mass bins (rows). The number of galaxies within in each stack is shown in the bottom left corner of each Hα stack thumbnail. Each thumbnail is 60 × 60 pixels, with 1 pixel = 0.05″. Emission-line maps were generated such that the spectral axis is along the x-direction, while the y-direction is the spatial axis (see Section 3.3).
Current usage metrics show cumulative count of Article Views (full-text article views including HTML views, PDF and ePub downloads, according to the available data) and Abstracts Views on Vision4Press platform.
Data correspond to usage on the plateform after 2015. The current usage metrics is available 48-96 hours after online publication and is updated daily on week days.
Initial download of the metrics may take a while.