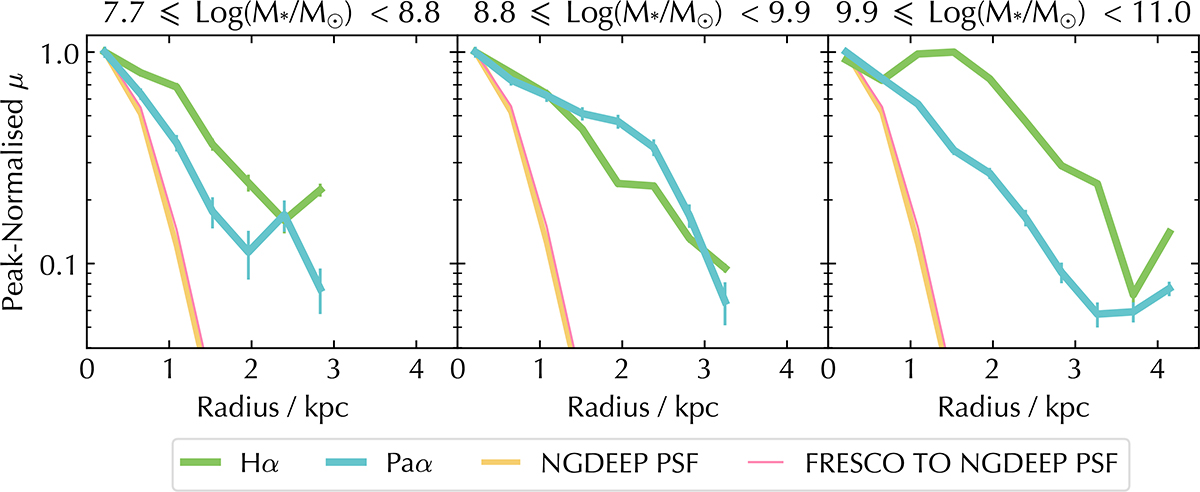
Fig. 5.
Download original image
Peak-normalised Hα (green) and Paα (turquoise) surface brightness profiles for our stacks shown in Figure 4. Both profiles are more extended than their PSFs, demonstrating that they are well resolved. At the lowest and highest masses, the Hα emission is more extended than the Paα emission, whereas their spatial profiles are similar for our middle stellar mass bin, at least out to ∼2 kiloparsecs after which the Paα emission is more extended than the Hα emission.
Current usage metrics show cumulative count of Article Views (full-text article views including HTML views, PDF and ePub downloads, according to the available data) and Abstracts Views on Vision4Press platform.
Data correspond to usage on the plateform after 2015. The current usage metrics is available 48-96 hours after online publication and is updated daily on week days.
Initial download of the metrics may take a while.