Fig. 7.
Download original image
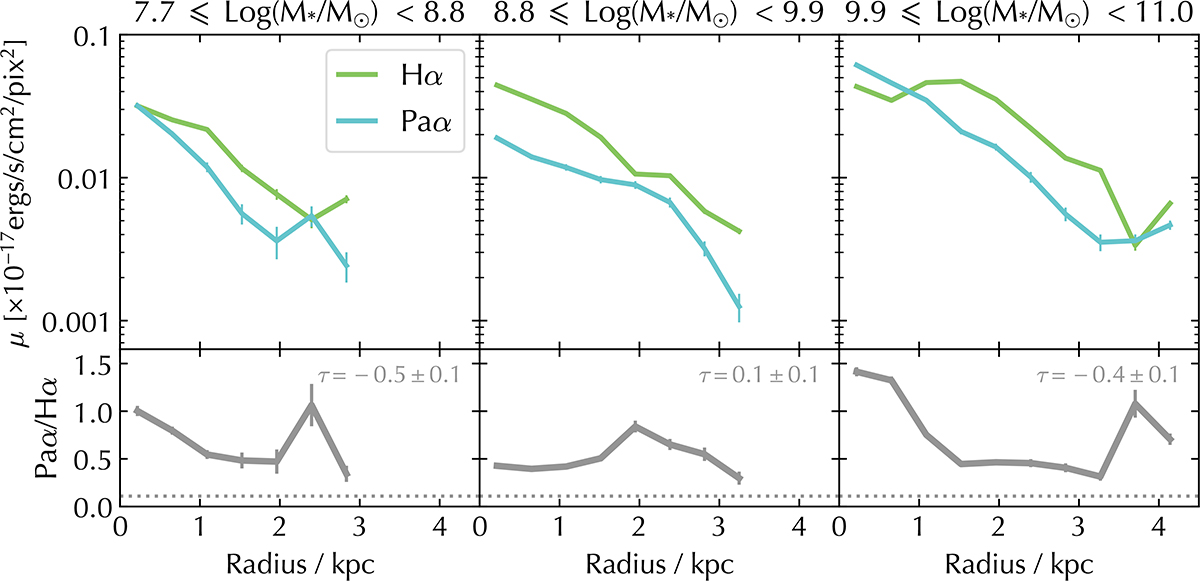
Surface brightness profiles for our Hα (green) and Paα (turquoise) stacks (top row) with their ratios (bottom row) and Kendall’s Tau (τ) correlation statistics. The horizontal dotted line shows the expected Paα/Hα line ratio for Case B recombination (Te = 10 000 K and ne = 100 cm−3 based on photoionisation modelling with CLOUDY (Ferland et al. 2017)). Declining Paα/Hα with galactocentric radius in our highest- and lowest-mass bins highlights the additional dust-obscured star formation that Paα traces closer to galactic centres, which decreases towards the outskirts.
Current usage metrics show cumulative count of Article Views (full-text article views including HTML views, PDF and ePub downloads, according to the available data) and Abstracts Views on Vision4Press platform.
Data correspond to usage on the plateform after 2015. The current usage metrics is available 48-96 hours after online publication and is updated daily on week days.
Initial download of the metrics may take a while.