Fig. 4
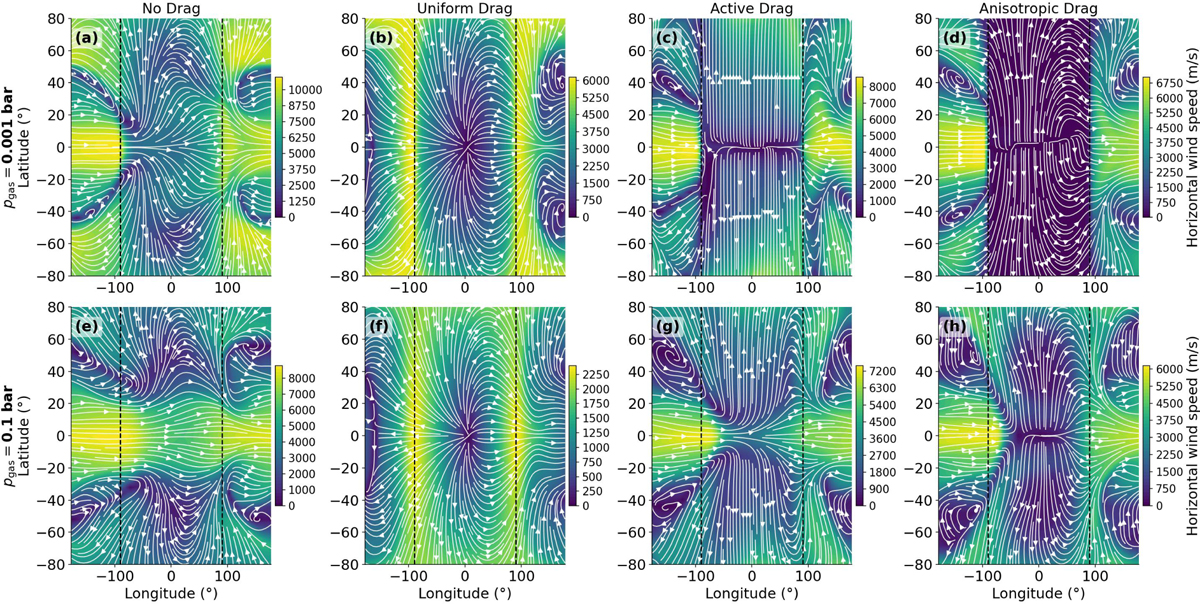
Download original image
Maps of horizontal wind speed |vh| and streamlines (white lines) at two pressure levels (pgas =0.1 bar and pgas =0.001 bar) for the four different magnetic drag treatments (no drag, uniform drag, active drag, and anisotropic drag). The substellar point is centered at each map. The vertical dashed black lines mark the area at longitude ±90◦. The output of each velocity component is time-averaged over 100 days of simulation time to eliminate the small-scale fluctuations.
Current usage metrics show cumulative count of Article Views (full-text article views including HTML views, PDF and ePub downloads, according to the available data) and Abstracts Views on Vision4Press platform.
Data correspond to usage on the plateform after 2015. The current usage metrics is available 48-96 hours after online publication and is updated daily on week days.
Initial download of the metrics may take a while.