Fig. 1.
Download original image
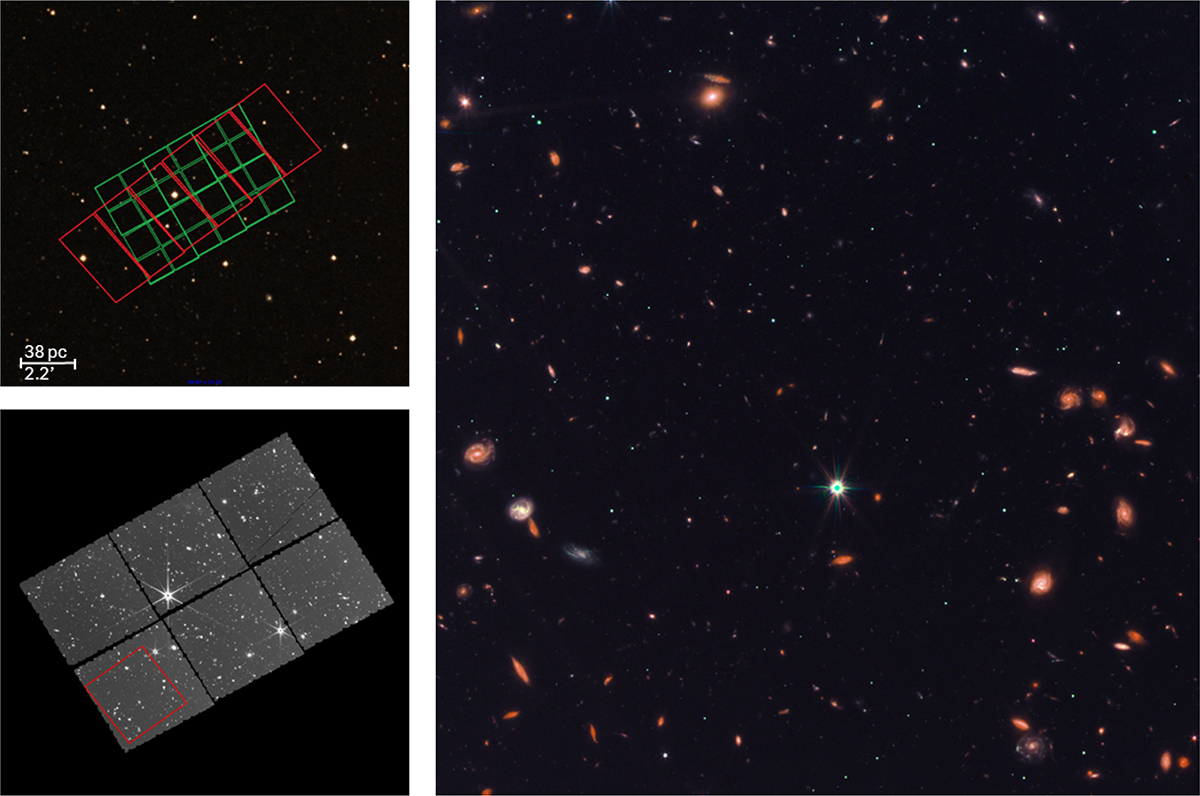
Footprints of the HST and JWST images used in this work are shown in red and green, respectively, in the top-left panel. The bottom-left panel displays the stacked NIRCam/F322W2 image used in our analysis. The right panel shows a three-color composite image of the region marked with a red square in the bottom-left panel, where the blue, green, and red channels correspond to the stacked F606W, F814W, and F322W2 images, respectively.
Current usage metrics show cumulative count of Article Views (full-text article views including HTML views, PDF and ePub downloads, according to the available data) and Abstracts Views on Vision4Press platform.
Data correspond to usage on the plateform after 2015. The current usage metrics is available 48-96 hours after online publication and is updated daily on week days.
Initial download of the metrics may take a while.