Open Access
Fig. 4.
Download original image
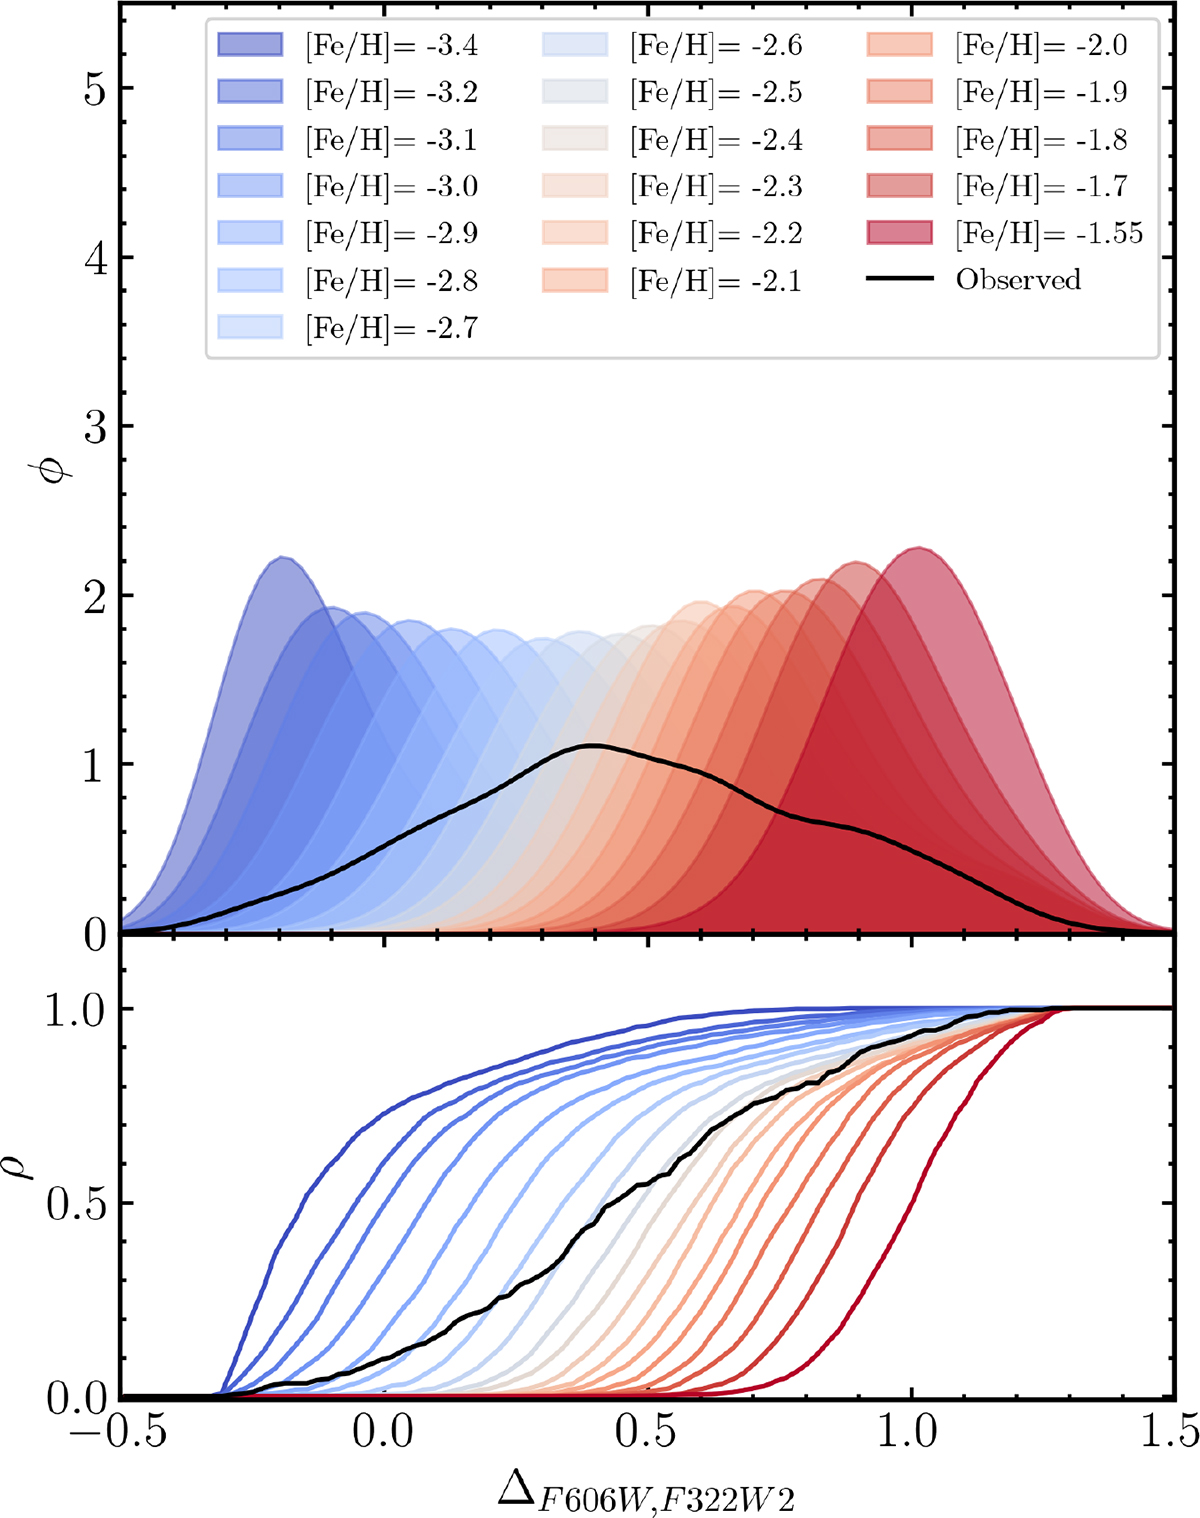
Kernel (top) and cumulative (bottom) distributions of ΔF606W, F322W2 for faint MS stars. The black curves are derived from the observed Boötes I members, while the colored curves are obtained from the simulated CMDs.
Current usage metrics show cumulative count of Article Views (full-text article views including HTML views, PDF and ePub downloads, according to the available data) and Abstracts Views on Vision4Press platform.
Data correspond to usage on the plateform after 2015. The current usage metrics is available 48-96 hours after online publication and is updated daily on week days.
Initial download of the metrics may take a while.