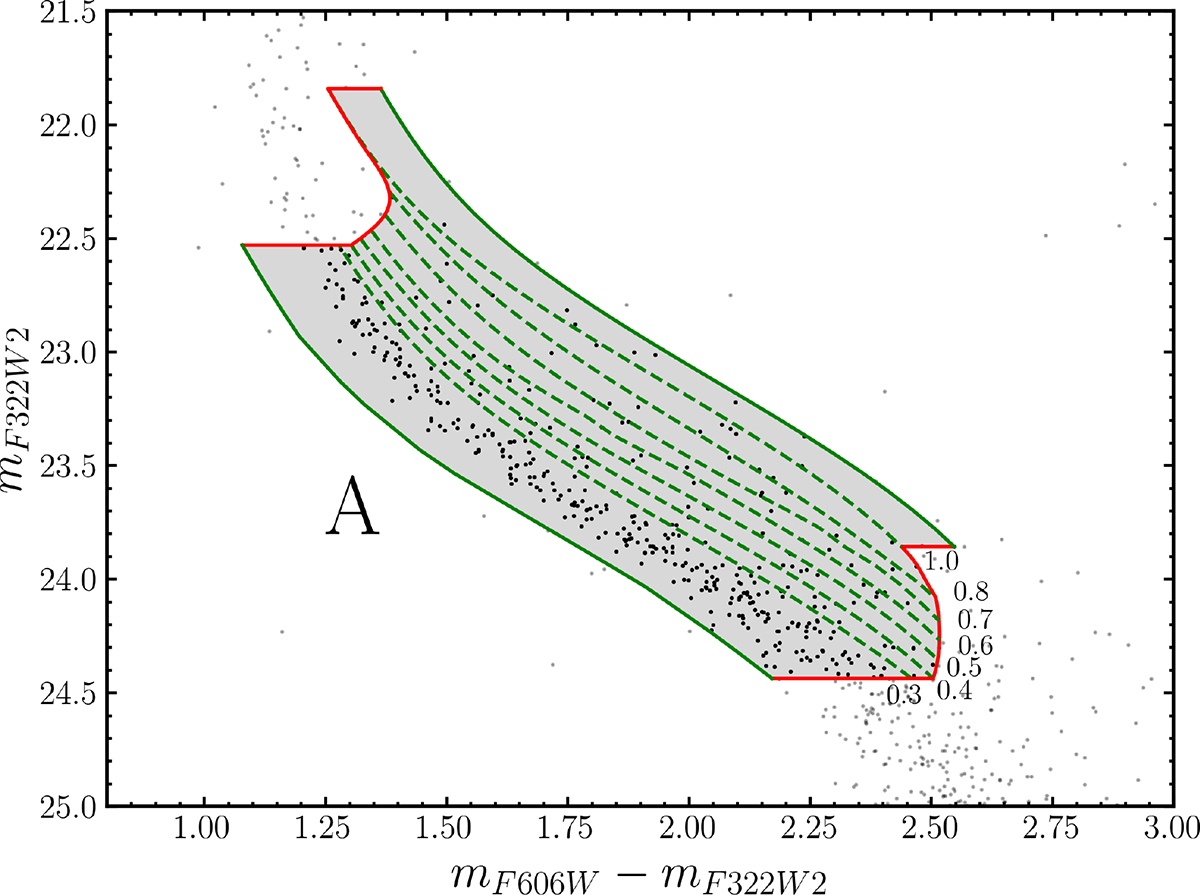
Fig. 6.
Download original image
mF322W2 vs. mF606W − mF322W2 CMD of Boötes I, where the gray shaded area indicates the region used to study binaries and derive the binary map. The nine green lines delimit the eight subregions (R1 − R8) adopted for the binary analysis. The bluest line represents the fiducial sequence of single stars, shifted to the blue to encompass the bulk of MS stars, while the reddest line corresponds to the fiducial of equal-mass binaries, shifted to the red to include most binaries. The remaining lines represent fiducial sequences of binaries with mass ratios ranging from 0.3 to 1.0, as indicated.
Current usage metrics show cumulative count of Article Views (full-text article views including HTML views, PDF and ePub downloads, according to the available data) and Abstracts Views on Vision4Press platform.
Data correspond to usage on the plateform after 2015. The current usage metrics is available 48-96 hours after online publication and is updated daily on week days.
Initial download of the metrics may take a while.