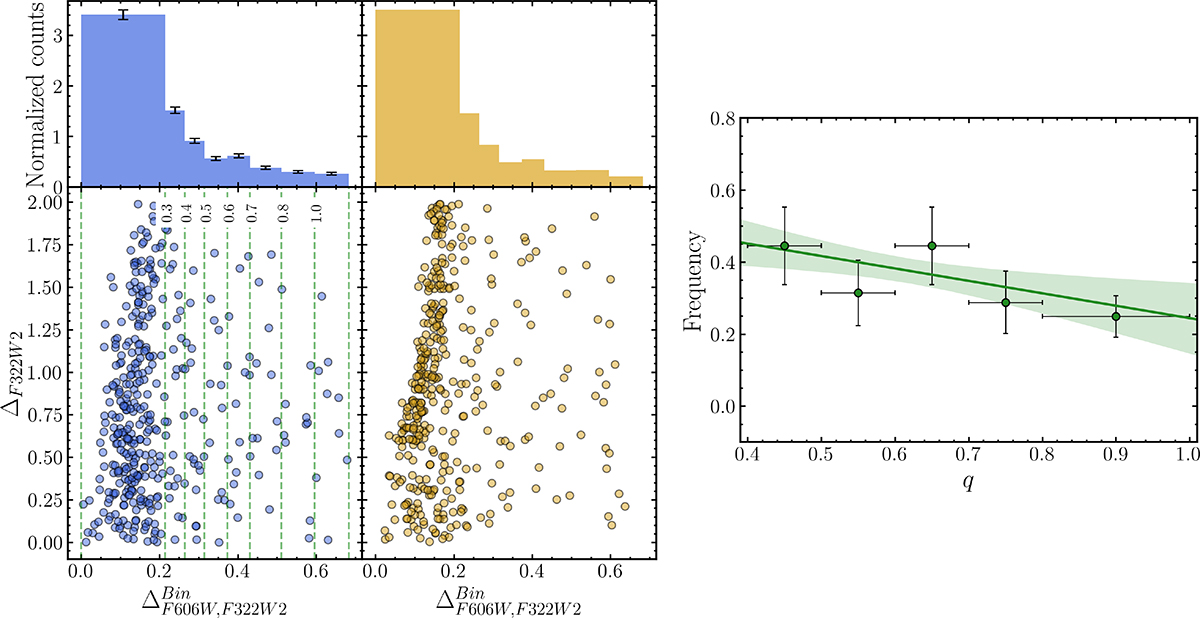
Fig. 7.
Download original image
Binary maps and mass-ratio distribution for Boötes I. Left: Observed binary map (in blue), with the corresponding ΔF606W, F322W2 distribution shown in the top panel. The vertical dashed lines indicate the nine reference loci used to construct the map, including the fiducial sequences of binary systems with different mass ratios, q, whose values are labeled in the figure. Middle: Best-fit binary map (in gold). Right: Mass-ratio distribution derived from the best fit; the green line and shaded region indicate the linear fit and its associated uncertainty.
Current usage metrics show cumulative count of Article Views (full-text article views including HTML views, PDF and ePub downloads, according to the available data) and Abstracts Views on Vision4Press platform.
Data correspond to usage on the plateform after 2015. The current usage metrics is available 48-96 hours after online publication and is updated daily on week days.
Initial download of the metrics may take a while.