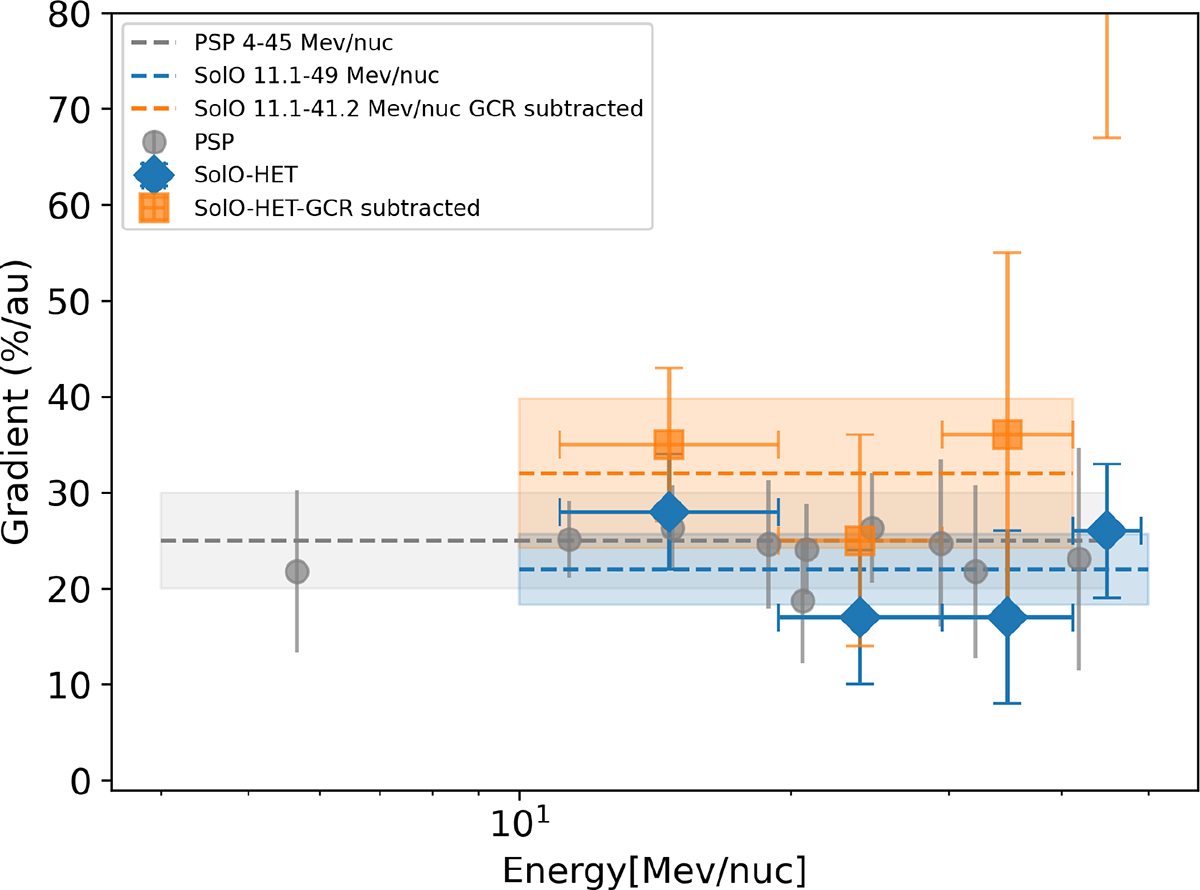
Fig. 5.
Download original image
Radial gradients of ACR helium are shown as a function of energy between 11.1 and 49 MeV/nuc. The blue points are the fitted results as in Fig. 4 and the orange squares further exclude the GCR contamination which are estimated from the BON2020 model, accompanied by their error bars. The grey circles represent the radial gradients obtained from PSP (Rankin et al. 2021). The dashed lines are the averaged gradient over the corresponding energy range.
Current usage metrics show cumulative count of Article Views (full-text article views including HTML views, PDF and ePub downloads, according to the available data) and Abstracts Views on Vision4Press platform.
Data correspond to usage on the plateform after 2015. The current usage metrics is available 48-96 hours after online publication and is updated daily on week days.
Initial download of the metrics may take a while.