| Issue |
A&A
Volume 708, April 2026
|
|
|---|---|---|
| Article Number | A36 | |
| Number of page(s) | 11 | |
| Section | The Sun and the Heliosphere | |
| DOI | https://doi.org/10.1051/0004-6361/202558218 | |
| Published online | 26 March 2026 | |
Anomalous cosmic rays within the inner heliosphere: Observations of helium by the High Energy Telescope on board Solar Orbiter
1
Institute of Experimental and Applied Physics, Christian-Albrechts-University Kiel, 24118 Kiel, Germany
2
California Institute of Technology, Pasadena, CA 91125, USA
3
Centre for Space Research, North-West University, Potchefstroom 2520, South Africa
4
University of Alcala, Space Research Group, Alcalá de Henares, Madrid, Spain
5
Deep Space Exploration Laboratory/School of Earth and Space Sciences, University of Science and Technology of China, Hefei 230026, P.R. China
★ Corresponding author: This email address is being protected from spambots. You need JavaScript enabled to view it.
Received:
22
November
2025
Accepted:
24
February
2026
Abstract
Context. The radial gradients of cosmic rays are key parameters in studies of the transport of particles in space. Solar Orbiter, launched on 2020 February 10, approaches the Sun approximately every half-a-year, with its closest perihelion distance of 0.29 au at the end of 2022 during the nominal mission phase. The two double-ended high-energy telescopes (HET) on board Solar Orbiter measure energetic particles in the energy range between a few MeV/nuc and a few hundreds of MeV/nuc. These particles are dominated by anomalous cosmic rays (ACRs) and galactic cosmic rays (GCRs) during solar quiet times.
Aims. By obtaining the radial gradient of ACR helium in the inner heliosphere, we can advance our understanding of how the transport of cosmic rays is affected by the particle drift effect and the large-scale magnetic field.
Methods. We analyzed helium observations at Solar Orbiter/HET between 11.1 and 49 MeV/nuc. Since our study is focused on quiet time measurements, we removed the periods of solar energetic particle (SEP) events. The intensities were averaged over the Carrington rotation period. The helium observations from the Electron Proton and Helium Instrument (EPHIN) on board SOHO were utilized as the baseline to correct the long-term variation caused by the solar modulations.
Results. We present the first observation of ACR helium at Solar Orbiter/HET between February 2020 and July 2022 in the inner heliosphere before the sun became fully active. We derived a radial gradient of ACR helium of between 0.3 and 1 au. The averaged radial gradient between 11.1 and 49 MeV/nuc is about 22 ± 4%/au and the averaged value between 11.1 and 41.2 MeV/nuc was raised to 32 ± 8%/au after removing the GCR contribution, which was estimated using a GCR model. In addition, the temporal variation of radial gradients indicates that gradients tend to increase with the enhancement of the solar modulation and the increased tilt angle of the heliospheric current sheet.
Key words: Sun: heliosphere / Sun: particle emission / interplanetary medium
© The Authors 2026
 Open Access article, published by EDP Sciences, under the terms of the Creative Commons Attribution License (https://creativecommons.org/licenses/by/4.0), which permits unrestricted use, distribution, and reproduction in any medium, provided the original work is properly cited.
This article is published in open access under the Subscribe to Open model. This email address is being protected from spambots. You need JavaScript enabled to view it. to support open access publication.
1. Introduction
Anomalous cosmic rays (ACRs) are thought to originate as interstellar neutrals, which become ionized in the interplanetary medium and are convected out to the outer heliosphere by the expanding interplanetary magnetic field, where they are accelerated and become energetic particles. (Fisk et al. 1974; Cummings et al. 2002; McComas & Schwadron 2006; Cummings & Stone 2007; Giacalone et al. 2022; Cummings et al. 2024, and references therein). After being accelerated, the energetic particles known as ACRs re-enter the heliosphere where their motions in the solar wind are determined by their interaction with the IMF.
The following physical processes are known to affect the propagation of particles: (a) diffusion caused by the irregular magnetic field; (b) convection and adiabatic energy loss due to the expanding solar wind; and (c) gradient and curvature drifts in the heliospheric magnetic field. Although these processes have been amply described and modeled in the cosmic ray transport equations in extensive studies of both ACRs and galactic cosmic rays (GCRs; e.g., Parker 1965; Jokipii et al. 1977; Jokipii & Thomas 1981; McDonald et al. 2001; Potgieter 2013; Giacalone et al. 2022; Engelbrecht et al. 2022), the detailed roles played by each component when they interact with the varying solar magnetic fields at different scales are still largely unexplored in the inner heliosphere; particularly in the region within 1 au which has hardly been visited by human-made spacecraft.
Among the many parameters that spacecraft can measure, spatial gradients (including both radial and latitudinal components) can specifically provide valuable insights into the variation of the charged particles’ drift motion across different solar cycles. As elucidated by theory (e.g., Jokipii et al. 1977; Jokipii & Kopriva 1979), the drift direction of energetic particles reverses when the polarity of the Sun’s magnetic field changes, which alternates approximately every 11 years and results in the formation of a 22-year variation (Cliver et al. 1996; Richardson et al. 1999). During the positive polarity (hereafter denoted by A+), the positively charged ions drift inward from the south and north pole regions, while moving outward along the equatorial plane through the heliospheric current sheet (HCS). Conversely, during the negative polarity (denoted as A–) period, ions drift toward the Sun along the HCS in the equatorial plane and exit through poles of the heliosphere. The drift direction of electrons is naturally opposite to that of ions due to the different charge sign. As anticipated by models and calculations, this phase-dependent behavior of cosmic rays might lead to several peculiar characteristics, such as a different radial gradient in ACRs’ intensities and an opposite sign of the latitudinal gradient across different cycles (Rankin et al. 2022; Giacalone et al. 2022, and references therein).
The recent solar activity minimum period that took place between 2018 and 2022 was characterized by an A+ phase. Consequently, the radial gradients in intensities that manifest the drift processes in the heliosphere were expected to be smaller than those in the last solar cycle and those with A– (Potgieter 2013). However, the measurements from IS⊙IS (McComas et al. 2016) on board the Parker Solar Probe (PSP; Fox et al. 2016) indicate that radial gradients of ACRs oxygen within 1 au between 2018 and 2020 are inconsistent with model predictions and measurements of previous solar minima within the same polarity, but comparable with the gradients of A– phase solar cycles (Rankin et al. 2021, 2022); this is despite the fact that previous observations correspond to the heliospheric region of larger distances (i.e., beyond 1 au). The radial gradients of ACR oxygen determined by Helios (Marquardt et al. 2018) are consistent with PSP’s result. The discrepancies in the radial gradient at different locations reveal the distinct magnetic field environment that might affect the diffusion of charged particles in the inner and outer heliosphere, which warrants further investigations. In addition, studies have shown unusual behaviors of GCR intensities over the past two solar minima, when the intensities peaked and reached historically high levels (Mewaldt et al. 2010; Zhao et al. 2014; Fu et al. 2021). The plausible explanations include the reduced solar wind dynamic pressure and a less turbulent magnetic field environment (Rankin et al. 2022).
In this study, we aim to deepen our understanding of cosmic ray variations and the above-mentioned discrepancies by utilizing the latest cosmic ray observations from the Solar Orbiter (SolO; Müller et al. 2020), launched on February 10, 2020 in the middle of this solar activity minimum period, traveling between 0.28 and 1 au. We focus our studies on the time period between 2020 and 2022 during the second half of the solar activity minimum between solar cycles 24 and 25. In Fig. 1, we show the orbit information of Solar Orbiter during the first four orbits from February 2020 to September 2022 before the solar activity maximum. The top panel (a) depicts the orbit track of Solar Orbiter in the Heliographic-Earth-Equatorial (HEEQ) coordinate system. In this coordinate system, the Sun (shown as a red dot) is positioned in the center while the Earth (blue dot) is fixed at 1 au. The trajectory of Solar Orbiter is twisted in this coordinate system. The color bar indicates the time order and the numbers are the rotations of the Sun from Solar Orbiter’s perspective (i.e., Solar Orbiter-perspective Carrington rotation) since it launched, marked at the beginning of each rotation and labeled next to the orbit track. Therefore, the flow direction of Solar Orbiter can be inferred from the increment in number and the change of colors. The orange dot-dashed circle line has a radius of 0.95 au. The five subpanels in Fig. 1b display the temporal variation of the radial distance of Solar Orbiter from the Sun, Carrington longitude, heliographic latitude of Solar Orbiter, and the distance as well as the longitudinal separation between Solar Orbiter and Earth. It should be noted that during this period, the latitude of Solar Orbiter was still constrained within a range of ∼±8 degrees of the ecliptic plane. Since the end of February 2025, Solar Orbiter has gradually been moving out of the ecliptic plane and has been observing from a higher latitude region. The orange portions in the first panel of Fig. 1b indicate when Solar Orbiter’s radial distance was greater than 0.95 au. Data from these time slots will be used to conduct a cross-comparison of energetic particle spectra between Solar Orbiter and various scientific instruments located near Earth.
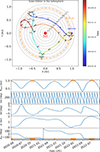 |
Fig. 1. (a): Orbit trajectories of Solar Orbiter (2020.02.28–2022.08.31) in the Stonyhurst heliographic coordinate system with the Earth fixed at 1 au as the blue dot. The color scale of the twisted trajectories represents the order of time since its launch. The first four orbits and 34 Solar Orbiter-perspective Carrington rotations are included in this figure. The dashed orange line represents a circle of 0.95 au radial distance. (b): Time variation of Solar Orbiter’s radial distance, Carrington longitude, and heliographic latitude, together with its relative distance (dr) and longitudinal (dlon) separation from Earth, shown from top to bottom. Orange segments over the blue line in the top panel indicate periods when the radial distance of Solar Orbiter exceeded 0.95 au and likewise for the grey and orange bars at the bottom of the figure. |
Solar Orbiter’s unique measurements of cosmic rays within 1 au, together with those from PSP, provide a valuable opportunity to investigate the unknown turbulent interplanetary environment that affects the propagation of cosmic rays close to the Sun. By deriving the radial gradient of energetic particles, these combined observations open a new regime for studying particle transport processes (Giacalone et al. 2022). This paper is organized as follows. Section 2 introduces the instrument and data we used in this study. In Sect. 3 we first present an overview of the first 2.5 years of ACR helium1 observations, after excluding the sporadic solar energetic particle (SEP) events that occurred in this period, along with a cross-comparison of different instruments. Subsequently, we provide the critical results of ACR helium radial gradients at different energies. We conclude the paper with a summary and discussion in Sect. 4.
2. Instruments
This study is based on the measurements of energetic particles from the high-energy telescope (HET), which is the higher energy component of the Energetic Particle Detector (EPD) suite on board Solar Orbiter2 (Rodríguez-Pacheco et al. 2020). HET consists of two double-ended telescopes measuring charged particles in the energy range from tens of MeV/nuc to a few hundreds of MeV/nuc. Within this energy coverage, the charged particles are dominated by ACRs and GCRs for quiet time, rather than energetic particles that originate from the Sun. Two identical HETs are mounted perpendicularly in the spacecraft’s ecliptic and polar plane, measuring particles coming from four directions.
Similarly to the results deriving from the suprathermal ion spectrograph (SIS), which have relatively larger uncertainties for the radial gradients (Mason et al. 2021), the accuracy of the radial gradients of helium calculated from HET is also limited by the counting statistics in each energy channel. As a result, we employed the following two methods to reduce uncertainties. Firstly, we averaged the measurements from four HET apertures, based on the assumption that cosmic rays are nearly isotropically distributed within those directions. By doing so, we were able to reduce the statistical uncertainty by a factor of 2 since we increased the count rate by a factor of 4. Then, we re-binned the fine energy channels of HET into four new energy channels, spanning the range from 10 to 50 MeV/nuc. The new energy bins were: 11.1–19.4 MeV/nuc, 19.4–29.5 MeV/nuc, 29.5–41.2 MeV/nuc, and 41.2–49.0 MeV/nuc.
In addition to Solar Orbiter/HET, we employed helium measurements from the new L3 data product3(Kühl & Heber 2019) from Electron Proton Helium Instrument (EPHIN) on board Solar and Heliospheric Observatory (SOHO; Müller-Mellin et al. 1995) and level 2 data4 from Solar Isotope Spectrometer (SIS; Stone et al. 1998) on board the Advanced Composition Explorer (ACE) at the first Lagrange point (L1), as well as data from the Lunar Lander Neutron and Dosimetry (LND)5 experiment (Wimmer-Schweingruber et al. 2020) on board the Chang’E-4 lander on the lunar far-side surface, for spectra comparison. Ultimately, only helium observations from SOHO/EPHIN served as the baseline of the long-term variation due to the solar modulation, which we used to calculate the radial gradient within 1 au, as it has a complete energy coverage between 10 and 50 MeV/nuc (i.e., the range covered by our analysis for both Solar Orbiter and SOHO/EPHIN). In Sect. 3.3, we provide more details of the analysis.
3. Observation
The observations are described in this section, including the cross-comparison for ACR helium spectra with multiple instruments in Sect. 3.1. We also present the temporal variations of ACR helium in Sect. 3.2 and calculations of the radial gradients in Sect. 3.3.
3.1. ACR helium near 1 au
Before extracting the subtle radial variations of ACR helium from Solar Orbiter measurements, it is crucial to first cross-compare the observations among different instruments, particularly during periods when Solar Orbiter was close to them. In Fig. 2, we display the ACR helium spectra from SOHO/EPHIN (orange squares, 7.8–53 MeV/nuc), ACE/SIS (green circles, 3.4–7.9 MeV/nuc), Chang’E-4/LND (grey circles, 9.7–34.5 MeV/nuc), and, most importantly, the spectrum from Solar Orbiter (blue diamonds), which has a broader energy coverage from a few MeV/nuc to a few hundreds of MeV/nuc. The filled diamonds represent stopping helium particles with energies between 7.2 and 104 MeV/nuc, while the empty diamonds are derived from penetrating channels where helium with energies between 147 MeV and 2 GeV were measured. This energy range is dominated by GCRs, rather than ACRs; hence, open diamonds were used to differentiate them. When we analyzed ACRs in this work, we only focused on the energy range between 10 and 50 MeV/nuc, which is the range where both SOHO/EPHIN and Solar Orbiter/HET have collected their measurements, indicated as the gray-shaded region in Fig. 2.
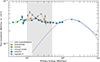 |
Fig. 2. Quiet-time helium spectra of Solar Orbiter/HET for stopping (filled blue diamonds) and penetrating (empty blue diamonds) particles, of ACE/SIS (green circles), and SOHO/EPHIN (orange squares) at L1, as well as Chang’E-4/LND (grey circles) measured at the lunar surface. The helium spectra were averaged over periods when Solar Orbiter was located between 0.95 and 1 au, as given in Table 1. The GCR spectrum predicted from the BON2020 model (Slaba & Whitman 2020) is given as the dashed line. Error bars indicate the statistical uncertainties. |
The spectra in Fig. 2 were averaged over periods when Solar Orbiter was located between 0.95 au and 1 au, excluding the contamination of SEPs to the background intensity, as discussed in Sect. 3.2 and the appendix. We identified five time periods from 2020 to 2023, with their specific start and end times listed in Table 1. In addition, the fourth column lists the radial distance separation between Solar Orbiter and Earth. The spectrum in gray circles in particular represents the first ACRs helium observations on the lunar far-side surface by Chang’E-4/LND. Past studies have confirmed that there was no significant discrepancy between the high-energy particle environment on the lunar surface and the deep space near the L1 point, during both SEP events and solar quiet time (Xu et al. 2020, 2022), which is expected since the Moon lacks a dense atmosphere and a global magnetic field.
Periods when Solar Orbiter was positioned between 0.95 and 1 au.
The quiet-time spectra from SOHO/EPHIN, ACE/SIS, and Chang’E-4/LND, all measuring particles in the near Earth region, display a general consistency across different energies during those specific time intervals. The averaged intensity ratio of Solar Orbiter/HET to the SOHO/EPHIN is 0.962 ± 0.016 within the energy range between ∼10 and ∼50 MeV/nuc. The spectrum of LND given in gray circles seems higher than the orange one from SOHO/EPHIN at the same energy range. One possible contributor of the enhanced intensity may be associated with the backsplash helium generated by interactions of GCRs with the lunar soil; however, this interpretation remains tentative and requires further validation, which is beyond the scope of this study. As a result, LND data were exclusively employed here for the overall spectral comparison and excluded from the following calculation of the ACR helium radial gradient.
The spectra comparison among four instruments shown in Fig. 2 shows that the helium spectrum that is averaged from four Solar Orbiter/HET apertures agrees with the counterparts at SOHO/EPHIN and ACE/SIS. Meanwhile, the higher energy spectra at HET show a good agreement with the prediction of the GCR spectrum by the Badhwar-O’Neill (BON-2020) model (Slaba & Whitman 2020). The model spectrum indicates the averaged intensities during periods listed in Table 1 (shown as a dashed line).
3.2. Temporal variation of the ACR helium intensity between 2020 and 2022
To obtain ACR helium, we consider the following two major factors that could affect the variation of the helium intensity. The first one is SEPs that are generated from the magnetic reconnection process during the solar flare eruptions and from the coronal mass ejection (CME) driven shocks via two different acceleration mechanisms (Desai & Giacalone 2016). The solar-originated helium could significantly enhance the helium intensity level and is the foremost disturbance to deal with in our study. Luckily, this study focuses on observations before September 2022, a period when solar activity remained low and only a few SEP events influenced helium intensity level. After mid-2022, many extremely intense eruptions, along with large SEP events, occurred and were observed by multiple spacecraft. A list of SEP periods is given in the appendix, along with a description of the method and the data we used to determine the SEP periods. We removed all those SEP periods from our analysis. The helium spectra in Fig. 2 comprise the results of the quiet-time phase without SEP events, in agreement with our expectations of the quiet-time spectra.
The second is the short-term but periodical modulation caused by the (recurring) compressed regions induced by the fast-slow solar wind stream pair emitted from the solar corona, which is known as stream interaction regions (SIRs) or corotating interaction regions (CIRs; Burlaga 1974; Gosling et al. 1976; Richardson 2004). These structures occur periodically within one solar rotation and change the solar wind pressure, density, level of magnetic turbulence and, as a result, lead to changes in the diffusion and scattering level of particles. Those changes in local conditions end up modifying the transport of cosmic rays, resulting in a decrease in intensity (Richardson 2004, 2018), even though such variations are not as significant as SEPs and long-term solar modulations. It should be noted that such effects could even extend to high latitudes, according to previous observations (McKibben et al. 1999), which will be considered in future works after Solar Orbiter moves out of the ecliptic plane. The periodical modulation of such solar structures on the cosmic-ray intensity can be reduced by averaging particle fluxes over a Carrington rotation presumably, as suggested by Rankin et al. (2021, 2022). Naturally, the Carrington rotation at Earth represents a full rotation of the Sun of a standardized period of 27.3 days. This period at Solar Orbiter is different than that at Earth, due to Solar Orbiter’s tangential velocity. From Solar Orbiter’s point of view, one full solar rotation is defined as the period between two adjacent peaks of Solar Orbiter Carrington longitude, which is depicted in the second panel from the top of Fig. 1. The Solar Orbiter-perspective Carrington rotation periods range between 26.6 and 35.8 days, although the characteristic of the recovery period vary with energy and species. We note that the potential differential modulation of cosmic-ray intensities by CIRs/SIRs at different heliocentric locations within 1 au is not accounted for in the present analysis (Luo et al. 2020, 2024).
It is worth noting that the interplanetary coronal mass ejections (ICMEs) observed at Solar Orbiter and SOHO are excluded from the respective datasets separately, due to their potential modulation on the cosmic ray intensity (e.g., Richardson & Cane 2011; Dumbović et al. 2011; Janvier et al. 2021). We identified the ICMEs that pass by the Solar Orbiter and the Earth separately from the existing ICME list provided by HELIO4CAST inter-planetary coronal mass ejection catalog (ICMECAT; Möstl et al. 2020; Moestl et al. 2020). In addition, we excluded an additional 1.5 days of post-ICME intervals, as a simplifying approximation of the Forbush decrease in recovery time; however, the characteristics of the recover phase could vary with particle energy and species and not all ICMEs show a measurable modulation in the ACR intensity.
After removing SEP periods and ICME periods, as well as averaging the remaining EPHIN and HET helium intensity profile over the corresponding Carrington rotation at Earth and Solar Orbiter independently, as suggested by Rankin et al. (2021), we obtained the data shown in the top two panels of Fig. 3. Specifically, these panels display the Carrington-averaged helium flux profile between 10 and 50 MeV/nuc for Solar Orbiter/HET and SOHO/EPHIN in four energy bins.
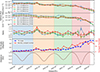 |
Fig. 3. Top two panels: Averaged helium intensity between ∼10 and ∼50 MeV/nuc measured by Solar Orbiter/HET (top panel) and SOHO/EPHIN (second panel) over the corresponding Carrington rotations between 2020 February and 2022 September. Third panel: Intensity ratio of Solar Orbiter/HET to SOHO/EPHIN. Fourth panel: Monthly averaged tilt angle of HCS and sunspot number (l). Bottom panel: Solar Orbiter’s radial distance. |
A noteworthy trend is that averaged fluxes decrease over time, due to the enhanced solar modulation during the early phase of the new solar cycle. In the fourth panel of Fig. 3, we present the temporal variations of the monthly sunspot number6 (Clette & Lefèvre 2015) and the averaged tilt angle of the heliospheric current sheet (HCS) calculated from a model using a radial boundary condition at the photosphere7, which indicates the maximum extent in latitude that could be reached by the computed HCS. These parameters show how the solar modulation changed significantly from the beginning to the end of our analysis period. The averaged monthly sunspot number reached about 100 in the middle of 2022 and, similarly, the tilt angle concurrently increased to more than 70°. Consequently, by the end of this period the helium intensities drop to roughly one-fifth of its peak level observed at the start of the mission and the ACR intensity further continues to decrease over the following years until the current solar activity maximum.
To isolate the intensity variations associated with the changing radial distance of Solar Orbiter, it is necessary to remove long-term trends from the measurements. It is reasonable to assume that the slow solar modulation affects the measurements within 1 au in a similar same way; therefore, its influence can be canceled out in the intensity ratio. We used the EPHIN-measured intensities as a reference baseline and calculated the HET-to-EPHIN intensity ratios for four individual energy channels. We linearly extrapolated the Carrington-averaged intensity of EPHIN from the center of the rotation to the central time of Solar Orbiter-perspective Carrington rotation to account for the time offset within two observations. The resulting ratios, shown in the third panel of Fig. 3, display systematic variability as a function of radial distance and will be used to derive the radial gradients in the following section. The bottom panel shows the variations of Solar Orbiter’s radial distance as a function of time to facilitate a direct comparison between the intensity ratio, which exhibits clear periodic pattern, and the spacecraft’s radial distance. The different colored blocks separate four successive orbits of Solar Orbiter.
3.3. Radial gradient
Based on the method from the literature (Vos & Potgieter 2016; Rankin et al. 2021), the radial gradient of cosmic rays can be expressed as
 (1)
(1)
where gr denotes the differential radial gradient component of intensity, namely, the change in the differential flux (f), with respect to radial distance (r), while f is the de-trended flux after considering the long-term solar modulation. In practice, we went on to fit the following function to the measurements using the least-squares method,
 (2)
(2)
where fSolO and fSOHO denote the intensity averaged over a Carrington rotation as measured by Solar Orbiter and SOHO, respectively, while r is the radial distance of Solar Orbiter. We assume that the radial gradient of ACR helium is approximately constant within 1 au between Earth and Solar Orbiter.
Figure 4 shows the scatter plots of the intensity ratios against radial distance for the first three orbits in separate colors,the same used for the different orbits in Fig. 3. The linearly fitted dashed lines at different energies for the first three orbits, together with their 95% confidence intervals are depicted accordingly in the same colors, respectively. When the y-axis is given in the log scale, the fitted lines are straight. It should be noted that measurements from the fourth orbit were excluded from the average radial gradient calculations, as their results carry extremely large uncertainties due to the limited counting statistics and were not therefore considered reliable. Outlier data points with ratio values significantly deviating from the mean values are excluded prior to performing the fit. Only two data points were removed: one is the peak ratio point in the second orbit that occurs near November 2020 and the other is the abnormal data point in the forth orbit near April 2022. The former might be due to the differential modulations at Solar Orbiter and Earth, as we discuss later in this paper; whereas while the latter is because of the removal of measurements due to a number of SEP events within that Carrington rotation. Only a day or two of measurements remain and, thus, cannot reflect the ACR helium intensity level of the whole Carrington rotation. In Table 2 we summarize the fitting results for the four orbits between 2020 February and 2022 July, as well as the average radial gradient derived for the first three orbits.
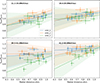 |
Fig. 4. Helium intensity ratios between Solar Orbiter/HET and SOHO/EPHIN as a function of Solar Orbiter’s radial distance during the first three orbits. The dashed lines are the fitted lines for each orbit, indicated by the colors. The y-axis is shown on a logarithmic scale. |
Radial gradients of ACR helium (%/au) between 0.5 and 1 au during the solar activity minimum 2024–25.
Figure 5 displays the energy dependence of the ACR helium radial gradients. The results for Solar Orbiter averaged over the first three orbits are shown as blue diamonds. We report radial gradients of 28 ± 6%/au, 17 ± 7%/au, 17 ± 9%/au and 26 ± 7%/au for helium energies of 11.1–19.4 MeV/nuc, 19.4–29.5 MeV/nuc, 29.5–41.2 MeV/nuc, and 41.2–49 MeV/nuc, respectively, with an overall average of 22 ± 4%/au between 11–49 MeV/nuc, which is shown as the blue horizontal line together with the uncertainties shown as blue shaded region. Such gradients are consistent with the measurements at PSP within the uncertainties (Rankin et al. 2021), which are shown as grey circles. The PSP results are derived from measurements between 2018 and 2019 in the same solar activity minimum but at an earlier phase. The averaged radial gradient of PSP measured ACR helium in the energy range of 4–45 MeV/nuc is about 25 ± 5%/au. We also considered the impact of GCR contribution on the ACR radial gradients. The results are shown as orange squares and a discussion is presented in the next section.
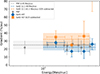 |
Fig. 5. Radial gradients of ACR helium are shown as a function of energy between 11.1 and 49 MeV/nuc. The blue points are the fitted results as in Fig. 4 and the orange squares further exclude the GCR contamination which are estimated from the BON2020 model, accompanied by their error bars. The grey circles represent the radial gradients obtained from PSP (Rankin et al. 2021). The dashed lines are the averaged gradient over the corresponding energy range. |
4. Summary and discussion
By removing the disturbance of SEPs, correcting the long-term solar modulation, and averaging the intensity over the Carrington rotations to mitigate the impacts of CIR and SIR, we obtained the ACR helium measured by Solar Orbiter/HET and derive the radial gradient for ACR helium in the inner heliosphere by fitting Eq. (2). The helium spectra obtained by Solar Orbiter/HET, SOHO/EPHIN, and ACE/SIS are generally consistent with each other when Solar Orbiter was close to 1 au. The mean radial gradient of 22 ± 4%/au for the energy range of 11–49 MeV/nuc is consistent with PSP’s report of a gradient of 25 ± 5%/au over energies of ∼4 to ∼45 MeV/nuc during the same solar minimum, considering the uncertainties. This agreement also holds for the energy-dependent radial gradients.
Although a general consistency has been established, it is still worth emphasizing the observational discrepancies between Solar Orbiter and PSP, which are manifested in the observation time and spatial coverage in the heliosphere. This study is focused on observations from early 2020 to mid-2022, while the PSP results (Rankin et al. 2021) were derived from the PSP observations during its first three orbits between 2018 August and 2019 November, a period just prior to the launch of the Solar Orbiter mission. There is no temporal overlap between the two studies, despite the fact that both Solar Orbiter and PSP were in the same solar minimum period. As the solar cycle evolves, the solar modulation, and the resulting radial gradient are not necessarily the same. As shown in the next-to-last row of Fig. 3, the variation of the sunspot number and the tilt angle of the HCS, which act as a proxy of the solar modulation, has vastly changed from the first to the fourth orbit of Solar Orbiter, and the strength of solar modulation reached a very high level at the end of our observations. In addition, as shown in Fig. 4, all data points used in our fitting analysis lie beyond 0.5 au. In contrast, the PSP observations cover a wider radial range, from 1 au down to 0.16 au. This discrepancy could partially explain the relatively larger error bars for each individual orbit (see Table 2), compared with those derived from PSP data.
In addition to ACR helium, the GCR helium is also non-negligible in the energy range from a few tens to a few hundreds of MeV/nuc. GCR helium intensities increase with energies and typically peak at a few hundreds of MeV/nuc. Therefore, the impact of the GCR helium on the radial gradient should also be considered within the 11.1–49 MeV/nuc energy range, particularly toward the higher energy end. Meanwhile, the turbulence in the interplanetary medium that varies with solar activities may affect the intensity variation of ACRs and GCRs differently. For instance, when turbulence condition was reduced during the 2019 solar minimum, the intensity of GCRs peaked at higher values than in earlier solar minima, while the ACRs did not exhibit corresponding enhancement (Strauss et al. 2023). Therefore, it is essential to properly subtract GCR intensities from the measured ACR intensities in order to derive the accurate radial gradients. Rankin et al. (2021) found that the radial gradient increases after subtracting the assumed GCR intensity. Hence, they concluded that the reported ACR radial gradient represents only a lower limit. This conclusion also holds for this study. To address this, we removed the same estimated GCR intensities from both Solar Orbiter and SOHO measurements. The GCR intensities were calculated from the Badhwar-O’Neill 2020 (BON2020) GCR Model (Slaba & Whitman 2020) based on the varying solar modulations. We assumed the same intensities at both locations at a given time by simply ignoring the minimal radial gradient of GCRs within 1 au (Marquardt & Heber 2019; Rankin et al. 2022). Although different GCR models might yield slightly different predictions, they generally predict similar intensities during solar minimum conditions, which are comparable to the available measurements (Xu et al. 2022; Liu et al. 2024). Hence, the selection of GCR models is not expected to significantly influence our results. We note that the dashed purple line shown in Fig. 2 is the averaged model spectrum over the same interval as the measurements, which closely reproduces the Solar Orbiter GCR helium intensities at penetrating-channel energies above several hundred MeV/nuc. Such an agreement further confirms the reliability of the model spectrum during these periods.
We derived the corrected radial gradients at different energies, which are shown as orange data points in Fig. 5. The radial gradients at all four energies become higher. The new radial gradients are 35 ± 8%/au, 25 ± 11%/au, 36 ± 19%/au, and 90 ± 23%/au for the energy range 11.1–19.4 MeV/nuc, 19.4–29.5 MeV/nuc, 29.5–41.2 MeV/nuc, and 41.2–49.0 MeV/nuc, respectively. The significantly enhanced radial gradient at the highest energy bin is not reliable, considering the existence of a larger portion of GCR particles whose intensities depend on the adopted GCR model. Deriving ACR helium and its radial gradients within this energy range is challenging and subject to a large uncertainty. Therefore, we simply ignored this outlier data point in the calculation of the average gradient. Future observations with longer accumulation times and improved GCR models might help refine these uncertainties.
Consequently, we obtained an average gradient of 32 ± 8%/au for 11.1–41.2 MeV/nuc, which is plotted as dashed orange line and the corresponding shaded region in Fig. 5. Unsurprisingly, this value is consistent with that derived from PSP measurements within the uncertainty, namely, a gradient of 34.3 ± 5.6%/au for 4.0–32.0 MeV/nuc derived from PSP/LET and 44.7 ± 10.2%/au for 13.4–45.3 MeV/nuc from PSP/HET, after subtracting the GCR contributions.
The interplay between particles and the large-scale magnetic field governs the transport of the cosmic rays in space, leading to the varying latitudinal and radial gradients of the cosmic rays (Cummings et al. 1987, 1995; Cummings & Stone 1999; Stone & Cummings 1999; Cummings et al. 2009). The magnetic field structures in the inner heliosphere, which are still poorly understood, differ significantly from those in the outer heliosphere. As discussed in Rankin et al. (2021, 2022), the radial component of the magnetic field predominates within 1 au, while the outer heliosphere tends to have more transverse terms; hence the transport and cross-field diffusion of particles could be different in these two regions. This might explain the higher ACR helium and oxygen radial gradient in the inner heliosphere than that beyond 1 au, regardless of the polarity of the Sun (Marquardt et al. 2018; Rankin et al. 2022).
Meanwhile, as the solar cycle progresses, the highly tilted HCS and increased solar activity may further disturb the large-scale IMF (Stone & Cummings 1999), thereby playing a role in shaping the radial gradient. The radial gradients vary over a solar cycle from solar minimum to solar maximum (Cummings & Stone 1999; Stone 2003; Leske et al. 2005) based on the measurements from Voyager in outer heliosphere. Within 1 au, ACRs are almost depleted and nearly unmeasurable during solar maximum (Leske et al. 2013; Giacalone et al. 2022); hence, such a determination has not been investigated in this region.
Therefore, based on the available measurements from the first four orbits of Solar Orbiter, we attempted to estimate the temporal variation of the radial gradients as the solar modulation progresses, with the results displayed in Fig. 6. The orbiter-wise radial gradients at different energies are displayed in different colors. The shaded regions represent the relatively large uncertainties of the radial gradients due to the limited counting statistics and the black line shows the average radial gradient across four energies. The averaged radial gradients for 11–49 MeV/nuc ACR helium increases from 15 ± 5%/au during the first orbit to 29.5 ± 8%/au in the third orbit. In the fourth orbit, the radial gradient drops to 20 ± 15%/au, with a considerably larger uncertainty. It should be noted that the temporal variations in Fig. 6 have not considered the GCR contribution to the ACR intensities and, hence, the above values are only the lower limits. After subtracting the estimated GCR intensity, the average radial gradient rises from 23.5 ± 8%/au at the first orbit to 81 ± 20%/au in the third orbit. While in the fourth orbit, the corrected radial gradient has an uncertainty that is greater than the radial gradient; therefore, we ignored this period. Despite the large uncertainties, the overall trend of the mean gradient seems evident nonetheless (i.e., as the solar cycle progresses), the radial gradients of ACR helium tend to strengthen within 1 au. Cummings et al. (2009) reported that when the tilt angle of HCS is larger than 30 degrees, ACRs are unable to propagate into the inner heliosphere via the drift process. The temporal evolution revealed by our results seems consistent with this scenario and demonstrates how the radial gradient evolves with the increase of the solar activity.
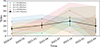 |
Fig. 6. Orbit-wise variations of the ACR helium radial gradients from February 2020 to July 2022 across four energies. |
Lastly, we wish to point out a dissimilarity in the ACR helium temporal profiles between HET and EPHIN. The affected data points have been excluded from our present radial gradient analysis and will not influence the current results. Between 2020 November and 2020 December (i.e., in the eleventh Solar Orbiter-perspective Carrington rotation), the helium intensity ratio of Solar Orbiter to SOHO/EPHIN is unusually higher. Intensity discrepancies of no less than 20% were found across all four channels, with a maximum ratio of 1.6 observed in the 40–50 MeV/nuc range (as shown in the third panel of Fig. 3). Since the intensity offset only occurs in one Carrington rotation period, we might speculate that such discrepancies could arise from the presence of local magnetic structures, such as large-scale ICMEs or strong shocks that affect one location (and not the other), thereby leading to differences in intensity. Indeed, ICMEs were detected by both Solar Orbiter and WIND during the corresponding Carrington rotation (as indicated by in situ measurements and the ICMECAT catalog); however, all observations obtained during these ICME intervals have already been excluded from our analysis. Therefore, the question of whether (and potentially how) these structures affect ACR intensities still warrants further investigation. Intriguingly, the higher ratio coincides with a local peak in the averaged sunspot number and tilt angle, as the red and blue lines in the fourth panel of Fig. 3 indicate. This could be a sign that the enhanced modulations impact the two locations in different ways that are not yet understood.
On February 18, 2025, Solar Orbiter finished its final gravity assist maneuver of Venus (VGAM) and gradually moved to higher latitudes to study the polar region, the last unexplored region of the Sun. This has provided a another valuable opportunity to measure the latitude gradient of energetic particles and to investigate the drift direction of the particles in the inner heliosphere. Together with PSP orbiting the Sun within the ecliptic plane, along with the newly launched Interstellar Mapping and Acceleration Probe (IMAP; McComas et al. 2025) mission at the L1 point, we might be able to gain further answers on how cosmic rays diffuse radially, longitudinally, and latitudinally within the inner heliosphere from the equator plane to the polar region and from the sun to the outer heliosphere.
In short, our results confirm the enhanced radial gradient reported by Rankin et al. (2021) at PSP within 1 au, which is larger than the previous measurements in the outer heliosphere. Our results can thus serve as a constraint on the transport modeling of ACRs in the inner heliosphere. Linking our current observations to the previous results and the present knowledge of cosmic rays can significantly advance our understanding of the role of drift and diffusion in the transport of cosmic rays and the processes that shape our heliosphere.
Acknowledgments
Solar Orbiter is a mission of international cooperation be-tween ESA and NASA, operated by ESA. This work was supported by the German Federal Ministry for Economic Affairs and Energy and the German Space Agency (Deutsches Zentrum für Luft- und Raumfahrt, e.V., (DLR)), grant number 50OT2002. Special thanks are given to C. Cohen and A. Cummings for multiple rounds of insightful discussion. The author also thanks Y. Wang and C. Corti for their assistance with the GCR model data.
References
- Burlaga, L. F. 1974, J. Geophys. Res., 79, 3717 [Google Scholar]
- Clette, F., & Lefèvre, L. 2015, SILSO Sunspot Number V2.0, https://doi.org/10.24414/qnza-ac80 [Google Scholar]
- Cliver, E. W., Boriakoff, V., & Bounar, K. H. 1996, J. Geophys. Res.: Space Phys., 101, 27091 [Google Scholar]
- Cummings, A., & Stone, E. 1999, Adv. Space Res., 23, 509 [Google Scholar]
- Cummings, A. C., & Stone, E. C. 2007, Space Sci. Rev., 130, 389 [NASA ADS] [CrossRef] [Google Scholar]
- Cummings, A. C., Stone, E. C., & Webber, W. R. 1987, Geophys. Res. Lett., 14, 174 [Google Scholar]
- Cummings, A. C., Mewaldt, R. A., Blake, J. B., et al. 1995, Geophys. Res. Lett., 22, 341 [NASA ADS] [CrossRef] [Google Scholar]
- Cummings, A. C., Stone, E. C., & Steenberg, C. D. 2002, ApJ, 578, 194 [NASA ADS] [CrossRef] [Google Scholar]
- Cummings, A. C., Tranquille, C., Marsden, R. G., Mewaldt, R. A., & Stone, E. C. 2009, Geophys. Res. Lett., 36, 2009GL039851 [Google Scholar]
- Cummings, A. C., Kóta, J., Richardson, J. D., Rankin, J. S., & Heikkila, B. C. 2024, ApJ, 977, 76 [Google Scholar]
- Desai, M., & Giacalone, J. 2016, Liv. Rev. Sol. Phys., 13, 3 [NASA ADS] [CrossRef] [Google Scholar]
- Dumbović, M., Vršnak, B., Čalogović, J., & Karlica, M. 2011, A&A, 531, A91 [NASA ADS] [CrossRef] [EDP Sciences] [Google Scholar]
- Engelbrecht, N. E., Effenberger, F., Florinski, V., et al. 2022, Space Sci. Rev., 218, 33 [CrossRef] [Google Scholar]
- Fisk, L. A., Kozlovsky, B., & Ramaty, R. 1974, ApJ, 190, L35 [Google Scholar]
- Fox, N. J., Velli, M. C., Bale, S. D., et al. 2016, Space Sci. Rev., 204, 7 [Google Scholar]
- Fu, S., Zhang, X., Zhao, L., & Li, Y. 2021, ApJS, 254, 37 [Google Scholar]
- Giacalone, J., Fahr, H., Fichtner, H., et al. 2022, Space Sci. Rev., 218, 22 [Google Scholar]
- Gosling, J. T., Hundhausen, A. J., & Bame, S. J. 1976, J. Geophys. Res., 81, 2111 [Google Scholar]
- Janvier, M., Démoulin, P., Guo, J., et al. 2021, ApJ, 922, 216 [NASA ADS] [CrossRef] [Google Scholar]
- Jokipii, J. R., & Kopriva, D. A. 1979, ApJ, 234, 384 [NASA ADS] [CrossRef] [Google Scholar]
- Jokipii, J. R., & Thomas, B. 1981, ApJ, 243, 1115 [NASA ADS] [CrossRef] [Google Scholar]
- Jokipii, J. R., Levy, E. H., & Hubbard, W. B. 1977, ApJ, 213, 861 [CrossRef] [Google Scholar]
- Kühl, P., & Heber, B. 2019, Space Weather, 17, 84 [CrossRef] [Google Scholar]
- Leske, R. A., Cummings, A. C., Cohen, C. M. S., et al. 2005, Int. Cosm. Ray Conf., 2, 113 [Google Scholar]
- Leske, R. A., Cummings, A. C., Mewaldt, R. A., & Stone, E. C. 2013, Space Sci. Rev., 176, 253 [Google Scholar]
- Liu, W., Guo, J., Wang, Y., & Slaba, T. C. 2024, ApJS, 271, 18 [Google Scholar]
- Luo, X., Zhang, M., Feng, X., et al. 2020, ApJ, 899, 90 [Google Scholar]
- Luo, X., Potgieter, M. S., Zhang, M., & Shen, F. 2024, ApJ, 961, 21 [NASA ADS] [CrossRef] [Google Scholar]
- Marquardt, J., & Heber, B. 2019, A&A, 625, A153 [NASA ADS] [CrossRef] [EDP Sciences] [Google Scholar]
- Marquardt, J., Heber, B., Potgieter, M. S., & Strauss, R. D. 2018, A&A, 610, A42 [NASA ADS] [CrossRef] [EDP Sciences] [Google Scholar]
- Mason, G. M., Ho, G. C., Allen, R. C., et al. 2021, A&A, 656, L5 [NASA ADS] [CrossRef] [EDP Sciences] [Google Scholar]
- McComas, D. J., & Schwadron, N. A. 2006, Geophys. Res. Lett., 33, L04102 [Google Scholar]
- McComas, D. J., Alexander, N., Angold, N., et al. 2016, Space Sci. Rev., 204, 187 [Google Scholar]
- McComas, D. J., Christian, E. R., Schwadron, N. A., et al. 2025, Space Sci. Rev., 221, 100 [Google Scholar]
- McDonald, F., Fujii, Z., Ferrando, P., et al. 2001, Int. Cosm. Ray Conf., 10, 3906 [Google Scholar]
- McKibben, R. B., Jokipii, J. R., Burger, R. A., et al. 1999, in Corotating Interaction Regions, eds. A. Balogh, J. T. Gosling, J. R. Jokipii, R. Kallenbach, & H. Kunow (Dordrecht: Springer, Netherlands), 7, 307 [Google Scholar]
- Mewaldt, R. A., Davis, A. J., Lave, K. A., et al. 2010, ApJ, 723, L1 [NASA ADS] [CrossRef] [Google Scholar]
- Moestl, C., Davies, E., & Weiler, E. 2020, HELIO4CAST Interplanetary Coronal Mass Ejection Catalog v2.3 [Google Scholar]
- Möstl, C., Weiss, A. J., Bailey, R. L., et al. 2020, ApJ, 903, 92 [Google Scholar]
- Müller, D., St. Cyr, O. C., Zouganelis, I., et al. 2020, A&A, 642, A1 [Google Scholar]
- Müller-Mellin, R., Kunow, H., Fleißner, V., et al. 1995, Sol. Phys., 162, 483 [Google Scholar]
- Parker, E. N. 1965, Planet. Space Sci., 13, 9 [Google Scholar]
- Potgieter, M. S. 2013, Liv. Rev. Sol. Phys., 10, 3 [Google Scholar]
- Rankin, J. S., McComas, D. J., Leske, R. A., et al. 2021, ApJ, 912, 139 [NASA ADS] [CrossRef] [Google Scholar]
- Rankin, J. S., Bindi, V., Bykov, A. M., et al. 2022, Space Sci. Rev., 218, 42 [NASA ADS] [CrossRef] [Google Scholar]
- Rankin, J. S., McComas, D. J., Leske, R. A., et al. 2022, ApJ, 925, 9 [NASA ADS] [CrossRef] [Google Scholar]
- Richardson, I. G. 2004, Space Sci. Rev., 111, 267 [Google Scholar]
- Richardson, I. G. 2018, Liv. Rev. Sol. Phys., 15, 1 [Google Scholar]
- Richardson, I. G., & Cane, H. V. 2011, Sol. Phys., 270, 609 [NASA ADS] [CrossRef] [Google Scholar]
- Richardson, I. G., Cane, H. V., & Wibberenz, G. 1999, J. Geophys. Res.: Space Phys., 104, 12549 [Google Scholar]
- Rodríguez-Pacheco, J., Wimmer-Schweingruber, R. F., Mason, G. M., et al. 2020, A&A, 642, A7 [Google Scholar]
- Slaba, T. C., & Whitman, K. 2020, Space Weather, 18, e2020SW002456 [CrossRef] [Google Scholar]
- Stone, E. C. 2003, in AIP Conference Proceedings (Pisa (Italy): AIP), 679, 47 [Google Scholar]
- Stone, E. C., & Cummings, A. C. 1999, Int. Cosm. Ray Conf., 7, 500 [Google Scholar]
- Stone, E. C., Cohen, C. M. S., Cook, W. R., et al. 1998, in The Advanced Composition Explorer Mission, eds. C. T. Russell, R. A. Mewaldt, T. T. Von Rosenvinge, et al. (Dordrecht: Springer, Netherlands), 357 [Google Scholar]
- Strauss, R. D., Leske, R. A., & Rankin, J. S. 2023, ApJ, 944, 114 [Google Scholar]
- Vos, E. E., & Potgieter, M. S. 2016, Sol. Phys., 291, 2181 [Google Scholar]
- Wimmer-Schweingruber, R. F., Yu, J., Böttcher, S. I., et al. 2020, ssr, 216, 104 [Google Scholar]
- Xu, Z., Guo, J., Wimmer-Schweingruber, R. F., et al. 2020, ApJ, 902, L30 [CrossRef] [Google Scholar]
- Xu, Z., Guo, J., Wimmer-Schweingruber, R. F., et al. 2022, Front. Astron. Space Sci., 9, 974946 [Google Scholar]
- Zhao, L., Qin, G., Zhang, M., & Heber, B. 2014, J. Geophys. Res.: Space Phys., 119, 1493 [Google Scholar]
This always refers to helium-4 in this paper.
Source: https://soar.esac.esa.int/soar/
Source: WDC-SILSO, Royal Observatory of Belgium, Brussels, DOI: https://doi.org/10.24414/qnza-ac80
Appendix A: Level-2 trigger and SEP determination
The methodology for the SEP period determination basically follows the three-sigma method, namely, SEP periods are defined as consecutive time intervals when the flux exceeds three times the standard deviation above the background. This method is commonly used to determine the onset time of SEP events, which could be further used for velocity dispersion analysis. Additionally, we added an extra 6 hour margin on the onset and end time, assuring the SEP contamination is largely excluded. The event list remains stable when different detection thresholds (i.e., different sigma levels) are applied.
Instead of using the actual helium measurements that have lower statistics, we utilized the higher count rate products including protons of SOHO/EPHIN in the energy range below 10 MeV and the level-2 trigger rate of HET to determine the possible SEP events. Such trigger rate is a multiple detector counter, namely HETany(A1, B1i) of Solar Orbiter/HET. It registers particles that can trigger any of those two SSDs, i.e., detectors A and the inner sector, which is what i stands for, of detector B of sunward telescope, in coincidence without the requirements to resolve the particle species and their primary energies. This counter has a large geometry factor, hence, it has better counting statistics, leading to a better determination of the onset and the end of the SEP events, than the nominal scientific data products. The hourly count rates of this level-2 trigger are approximately 600 to 800 during quiet time. The completed SEP periods that we removed separately from the data are given below in Tables A.1 and A.2.
Removed SEP periods of Solar Orbiter, determined from the HETany(a1, b1i) counter.
SEP periods of EPHIN, determined from the 4 - 8 MeV proton time profile.
All Tables
Radial gradients of ACR helium (%/au) between 0.5 and 1 au during the solar activity minimum 2024–25.
Removed SEP periods of Solar Orbiter, determined from the HETany(a1, b1i) counter.
All Figures
|
Fig. 1. (a): Orbit trajectories of Solar Orbiter (2020.02.28–2022.08.31) in the Stonyhurst heliographic coordinate system with the Earth fixed at 1 au as the blue dot. The color scale of the twisted trajectories represents the order of time since its launch. The first four orbits and 34 Solar Orbiter-perspective Carrington rotations are included in this figure. The dashed orange line represents a circle of 0.95 au radial distance. (b): Time variation of Solar Orbiter’s radial distance, Carrington longitude, and heliographic latitude, together with its relative distance (dr) and longitudinal (dlon) separation from Earth, shown from top to bottom. Orange segments over the blue line in the top panel indicate periods when the radial distance of Solar Orbiter exceeded 0.95 au and likewise for the grey and orange bars at the bottom of the figure. |
| In the text | |
|
Fig. 2. Quiet-time helium spectra of Solar Orbiter/HET for stopping (filled blue diamonds) and penetrating (empty blue diamonds) particles, of ACE/SIS (green circles), and SOHO/EPHIN (orange squares) at L1, as well as Chang’E-4/LND (grey circles) measured at the lunar surface. The helium spectra were averaged over periods when Solar Orbiter was located between 0.95 and 1 au, as given in Table 1. The GCR spectrum predicted from the BON2020 model (Slaba & Whitman 2020) is given as the dashed line. Error bars indicate the statistical uncertainties. |
| In the text | |
|
Fig. 3. Top two panels: Averaged helium intensity between ∼10 and ∼50 MeV/nuc measured by Solar Orbiter/HET (top panel) and SOHO/EPHIN (second panel) over the corresponding Carrington rotations between 2020 February and 2022 September. Third panel: Intensity ratio of Solar Orbiter/HET to SOHO/EPHIN. Fourth panel: Monthly averaged tilt angle of HCS and sunspot number (l). Bottom panel: Solar Orbiter’s radial distance. |
| In the text | |
|
Fig. 4. Helium intensity ratios between Solar Orbiter/HET and SOHO/EPHIN as a function of Solar Orbiter’s radial distance during the first three orbits. The dashed lines are the fitted lines for each orbit, indicated by the colors. The y-axis is shown on a logarithmic scale. |
| In the text | |
|
Fig. 5. Radial gradients of ACR helium are shown as a function of energy between 11.1 and 49 MeV/nuc. The blue points are the fitted results as in Fig. 4 and the orange squares further exclude the GCR contamination which are estimated from the BON2020 model, accompanied by their error bars. The grey circles represent the radial gradients obtained from PSP (Rankin et al. 2021). The dashed lines are the averaged gradient over the corresponding energy range. |
| In the text | |
|
Fig. 6. Orbit-wise variations of the ACR helium radial gradients from February 2020 to July 2022 across four energies. |
| In the text | |
Current usage metrics show cumulative count of Article Views (full-text article views including HTML views, PDF and ePub downloads, according to the available data) and Abstracts Views on Vision4Press platform.
Data correspond to usage on the plateform after 2015. The current usage metrics is available 48-96 hours after online publication and is updated daily on week days.
Initial download of the metrics may take a while.