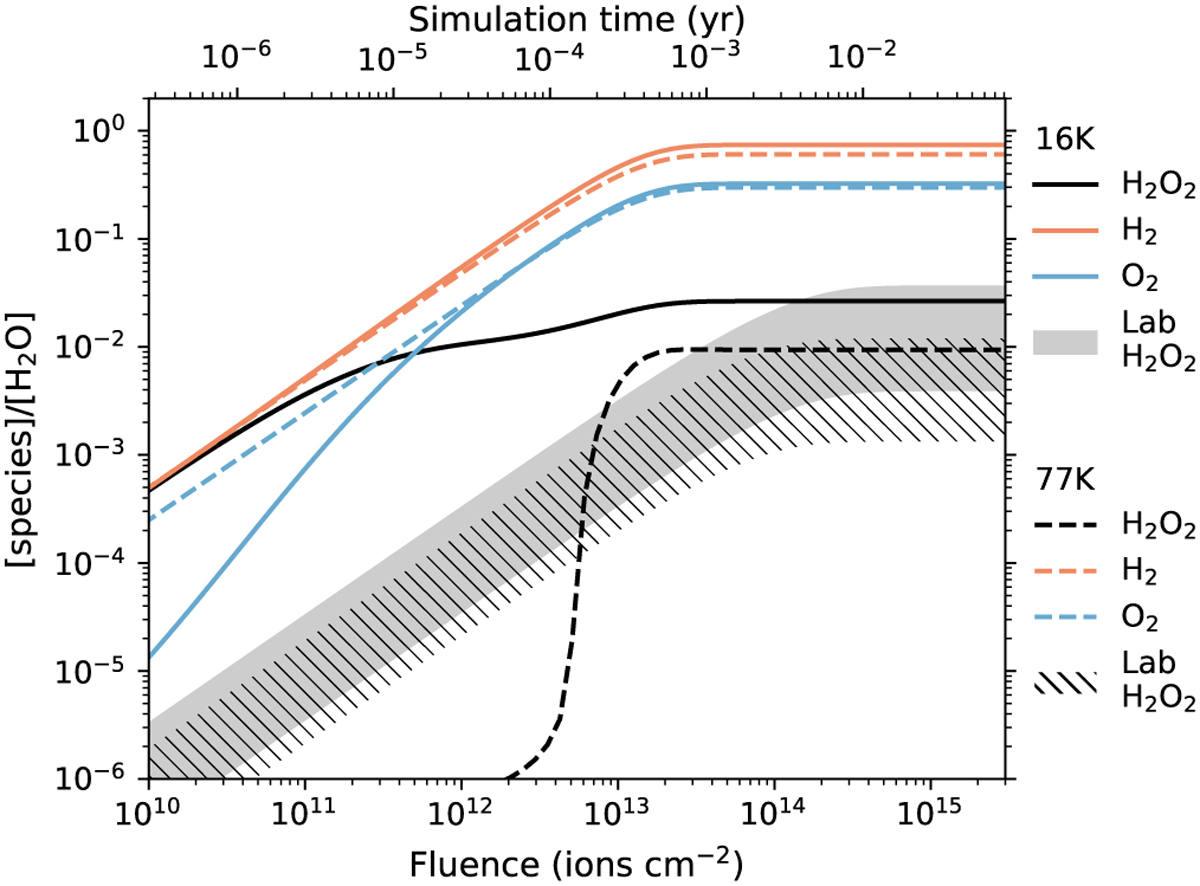
Fig. 1
Download original image
Simulation results of abundance ratios [H2O2]/[H2O] (black lines), [H2]/[H2O] (orange lines), and [O2]/[H2O] (blue lines) with our model (model A) at 16 K (solid lines) and 77 K (dashed lines). The shaded gray and line-filled regions show the experimental results of [H2O2]/[H2O] by Gomis et al. (2004a) at 16 and 77 K, respectively, with an assumed uncertainty of a factor of three.
Current usage metrics show cumulative count of Article Views (full-text article views including HTML views, PDF and ePub downloads, according to the available data) and Abstracts Views on Vision4Press platform.
Data correspond to usage on the plateform after 2015. The current usage metrics is available 48-96 hours after online publication and is updated daily on week days.
Initial download of the metrics may take a while.