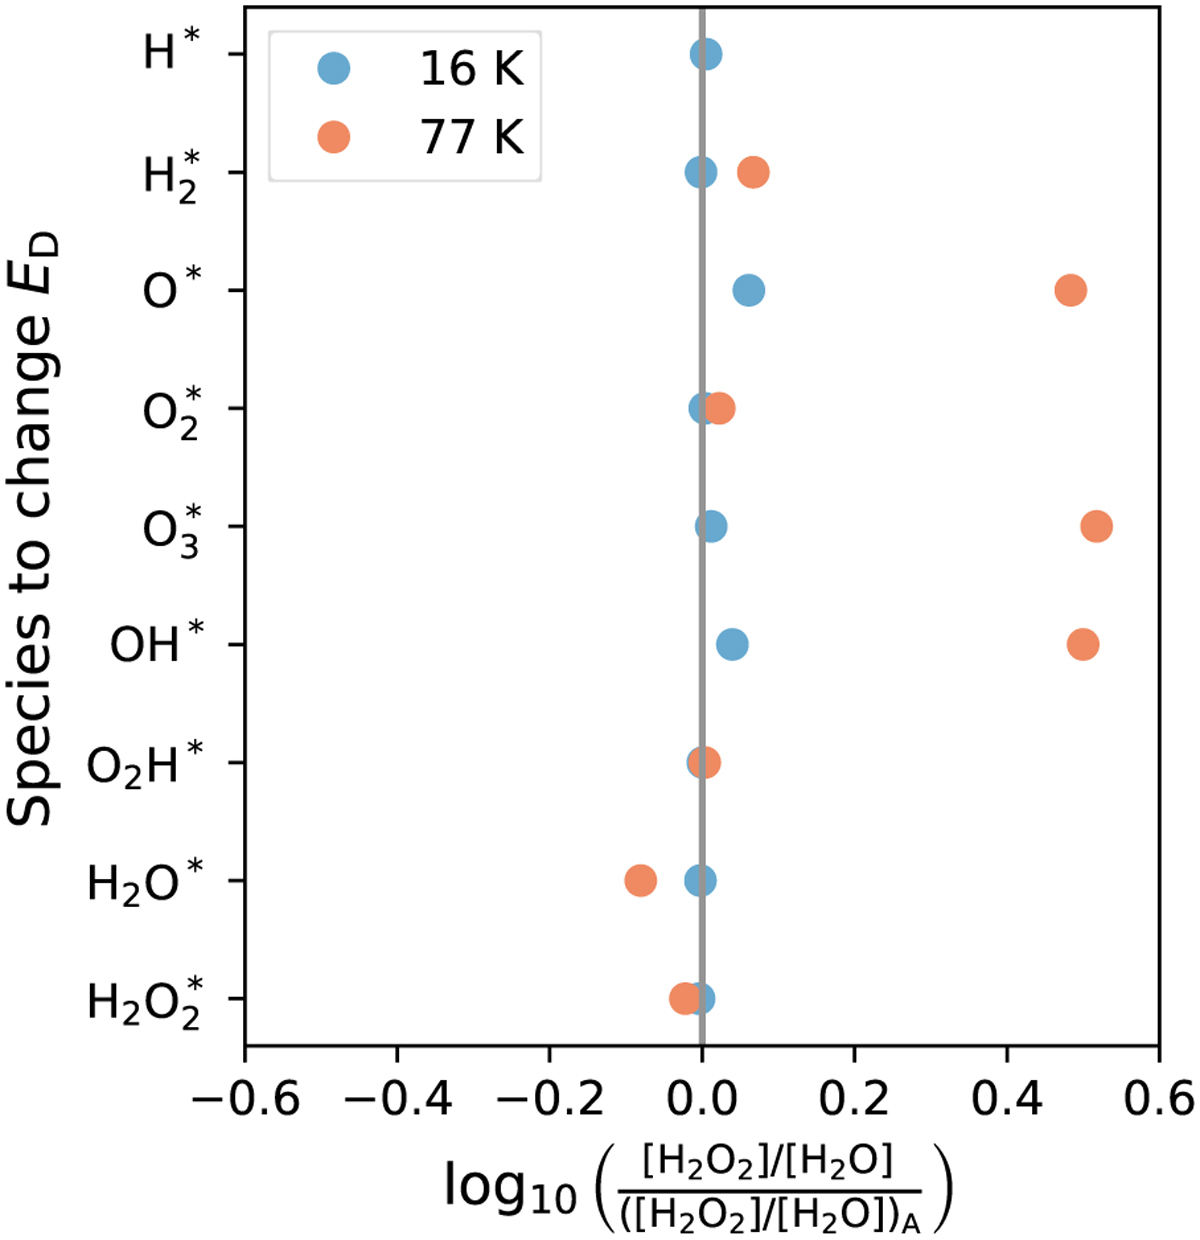
Fig. 8
Download original image
Logarithm of the ratio between the simulated [H2O2]/[H2O] obtained after lowering the desorption energy of a specific suprathermal species by an order of magnitude and the simulated [H2O2]/[H2O] in model A. Results at 16 K are shown in blue and those at 77 K are shown in orange. The vertical gray line indicates the positions where [H2O2]/[H2O] is unchanged after modifying the desorption energy. The ratio obtained by changing the ED of H* at 77 K is −3.86, far outside the range of the x-axis, and is therefore not plotted.
Current usage metrics show cumulative count of Article Views (full-text article views including HTML views, PDF and ePub downloads, according to the available data) and Abstracts Views on Vision4Press platform.
Data correspond to usage on the plateform after 2015. The current usage metrics is available 48-96 hours after online publication and is updated daily on week days.
Initial download of the metrics may take a while.