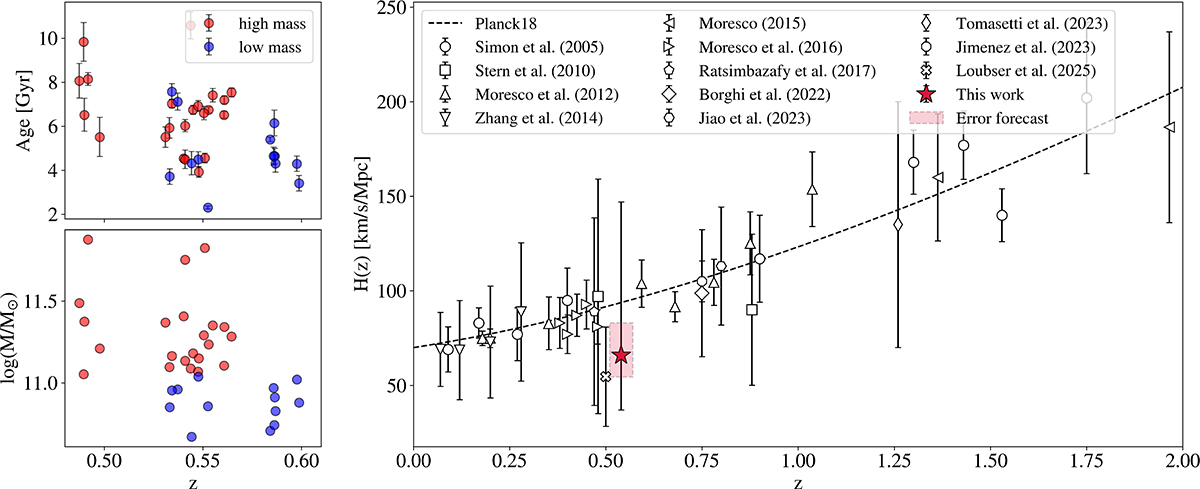
Fig. 3.
Download original image
Collection of all H(z) measurements obtained to date (Simon et al. 2005; Stern et al. 2010a; Moresco et al. 2012; Zhang et al. 2014; Moresco 2015; Moresco et al. 2016; Ratsimbazafy et al. 2017; Borghi et al. 2022b; Jiao et al. 2023; Tomasetti et al. 2023; Jiao et al. 2023; Loubser et al. 2025; Loubser 2025), including the result of this work. For comparison, the dashed line represents the flat ΛCDM trend from Planck18. The red shaded box shows the forecast on the precision achievable with a sample of 100 CCs (see Sect. 4.2 for details).
Current usage metrics show cumulative count of Article Views (full-text article views including HTML views, PDF and ePub downloads, according to the available data) and Abstracts Views on Vision4Press platform.
Data correspond to usage on the plateform after 2015. The current usage metrics is available 48-96 hours after online publication and is updated daily on week days.
Initial download of the metrics may take a while.