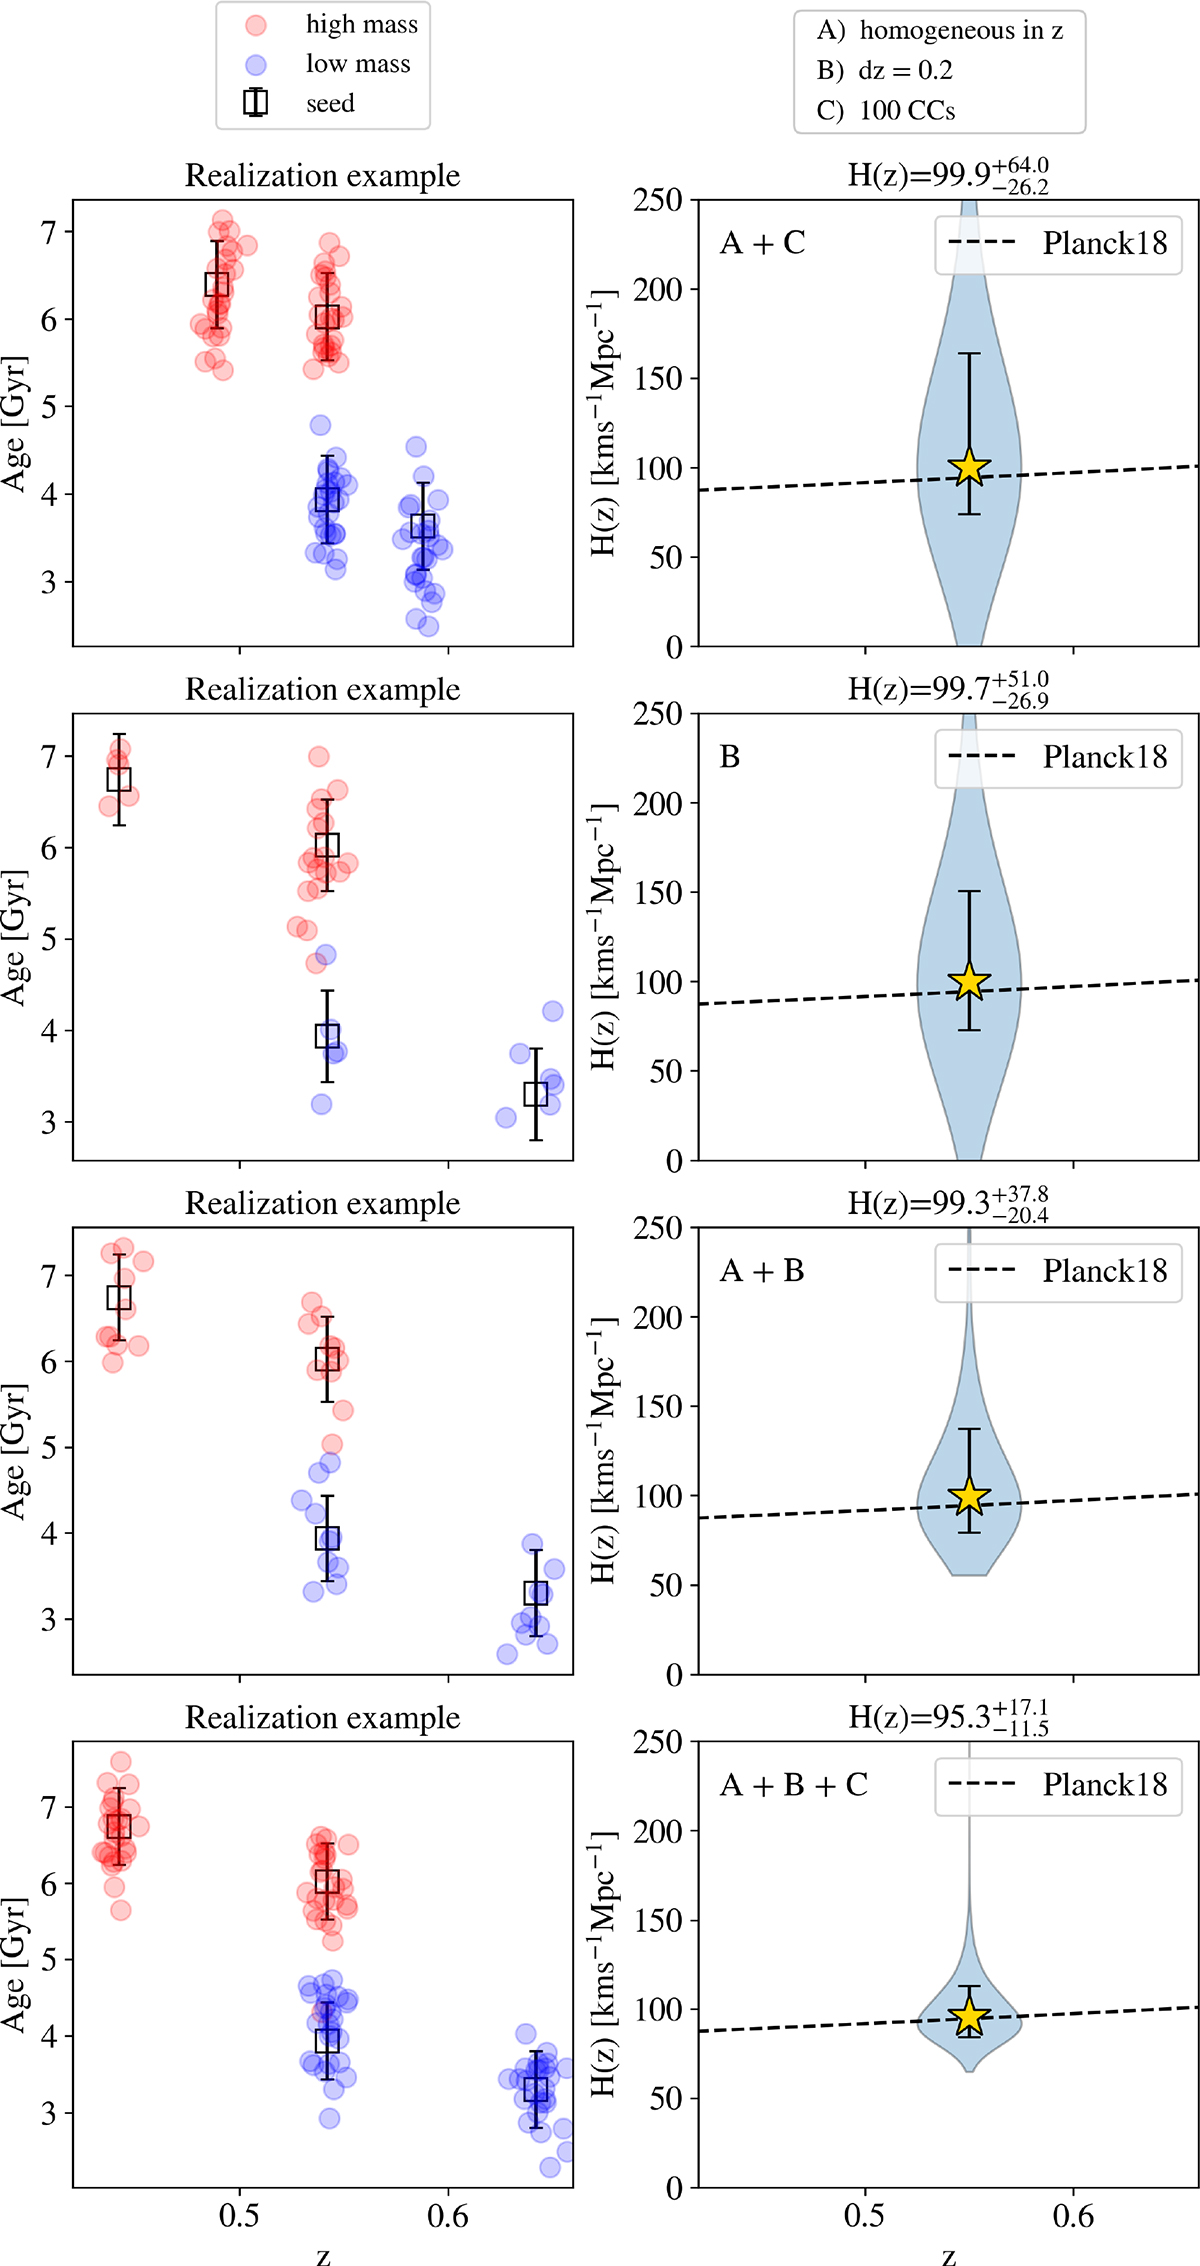
Fig. 4.
Download original image
Results of the simulations. Left column: For each setting, an example of an age–redshift relation for the HM (red) and LM (blue) samples, randomly extracted from a Gaussian distribution centred on the seed (black). Right column: Resulting H(z) distribution and the derived measurement (yellow star, also reported in the title), in comparison with the assumed cosmology (Planck Collaboration VI 2020).
Current usage metrics show cumulative count of Article Views (full-text article views including HTML views, PDF and ePub downloads, according to the available data) and Abstracts Views on Vision4Press platform.
Data correspond to usage on the plateform after 2015. The current usage metrics is available 48-96 hours after online publication and is updated daily on week days.
Initial download of the metrics may take a while.