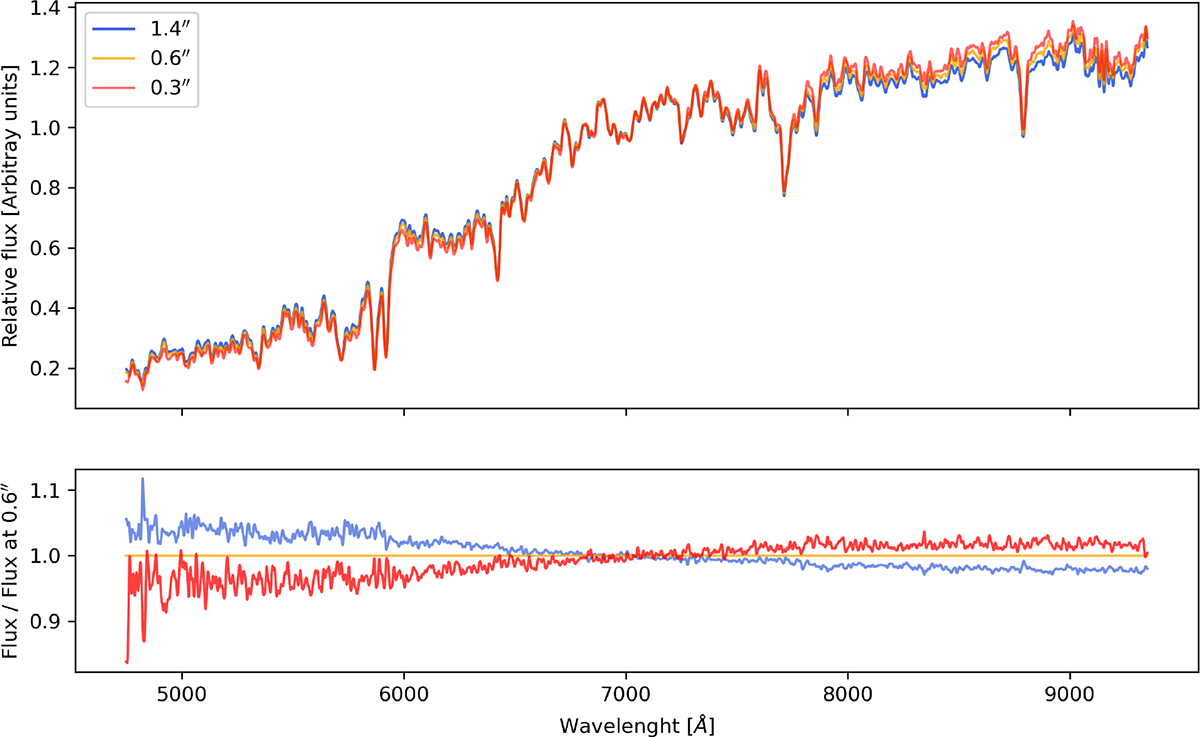
Fig. A.1.
Download original image
Example showing the effect of the aperture sizes on the extraction of a 1D spectrum from a MUSE data cube. Top: Spectrum of the same member of the cluster SDSS 2222, extracted using circular apertures of radius 1.4″ (blue), 0.6″ (orange), and 0.3″ (red). Bottom: Ratio between each spectrum and the one extracted with the 0.3″ aperture. A bigger extraction aperture produces a bluer spectrum (namely, the spectrum shows a larger flux at lower wavelengths).
Current usage metrics show cumulative count of Article Views (full-text article views including HTML views, PDF and ePub downloads, according to the available data) and Abstracts Views on Vision4Press platform.
Data correspond to usage on the plateform after 2015. The current usage metrics is available 48-96 hours after online publication and is updated daily on week days.
Initial download of the metrics may take a while.