Open Access
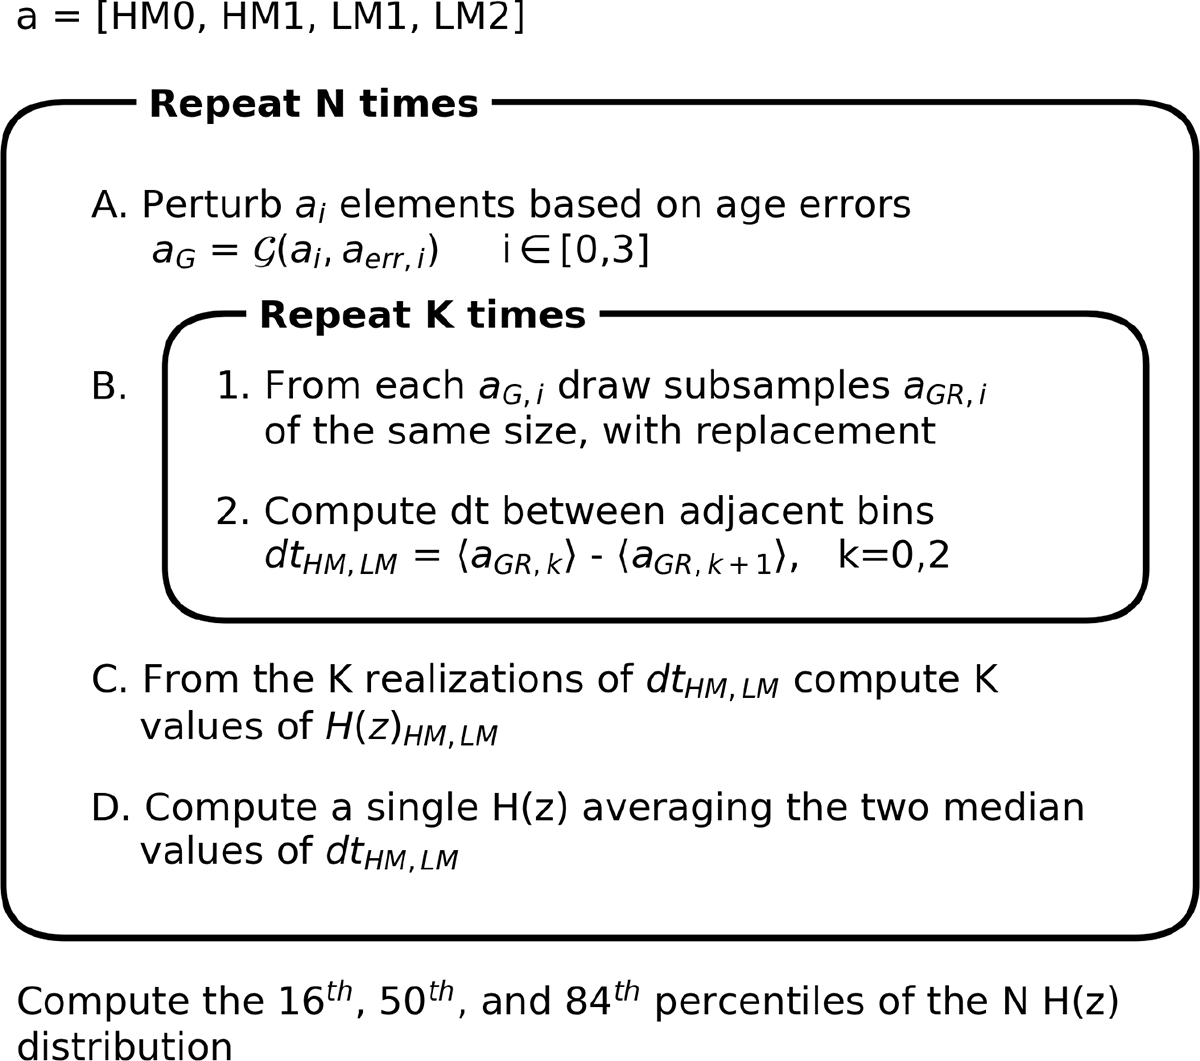
Fig. B.1.
Download original image
Visual diagram of the bootstrap algorithm. The CC sample was divided into three redshift bins (0, 1, and 2) and into two mass bins, HM and LM, but only bins HM0, HM1, LM1, and LM2 had enough statistics to be used.
Current usage metrics show cumulative count of Article Views (full-text article views including HTML views, PDF and ePub downloads, according to the available data) and Abstracts Views on Vision4Press platform.
Data correspond to usage on the plateform after 2015. The current usage metrics is available 48-96 hours after online publication and is updated daily on week days.
Initial download of the metrics may take a while.