Open Access
Fig. B.1.
Download original image
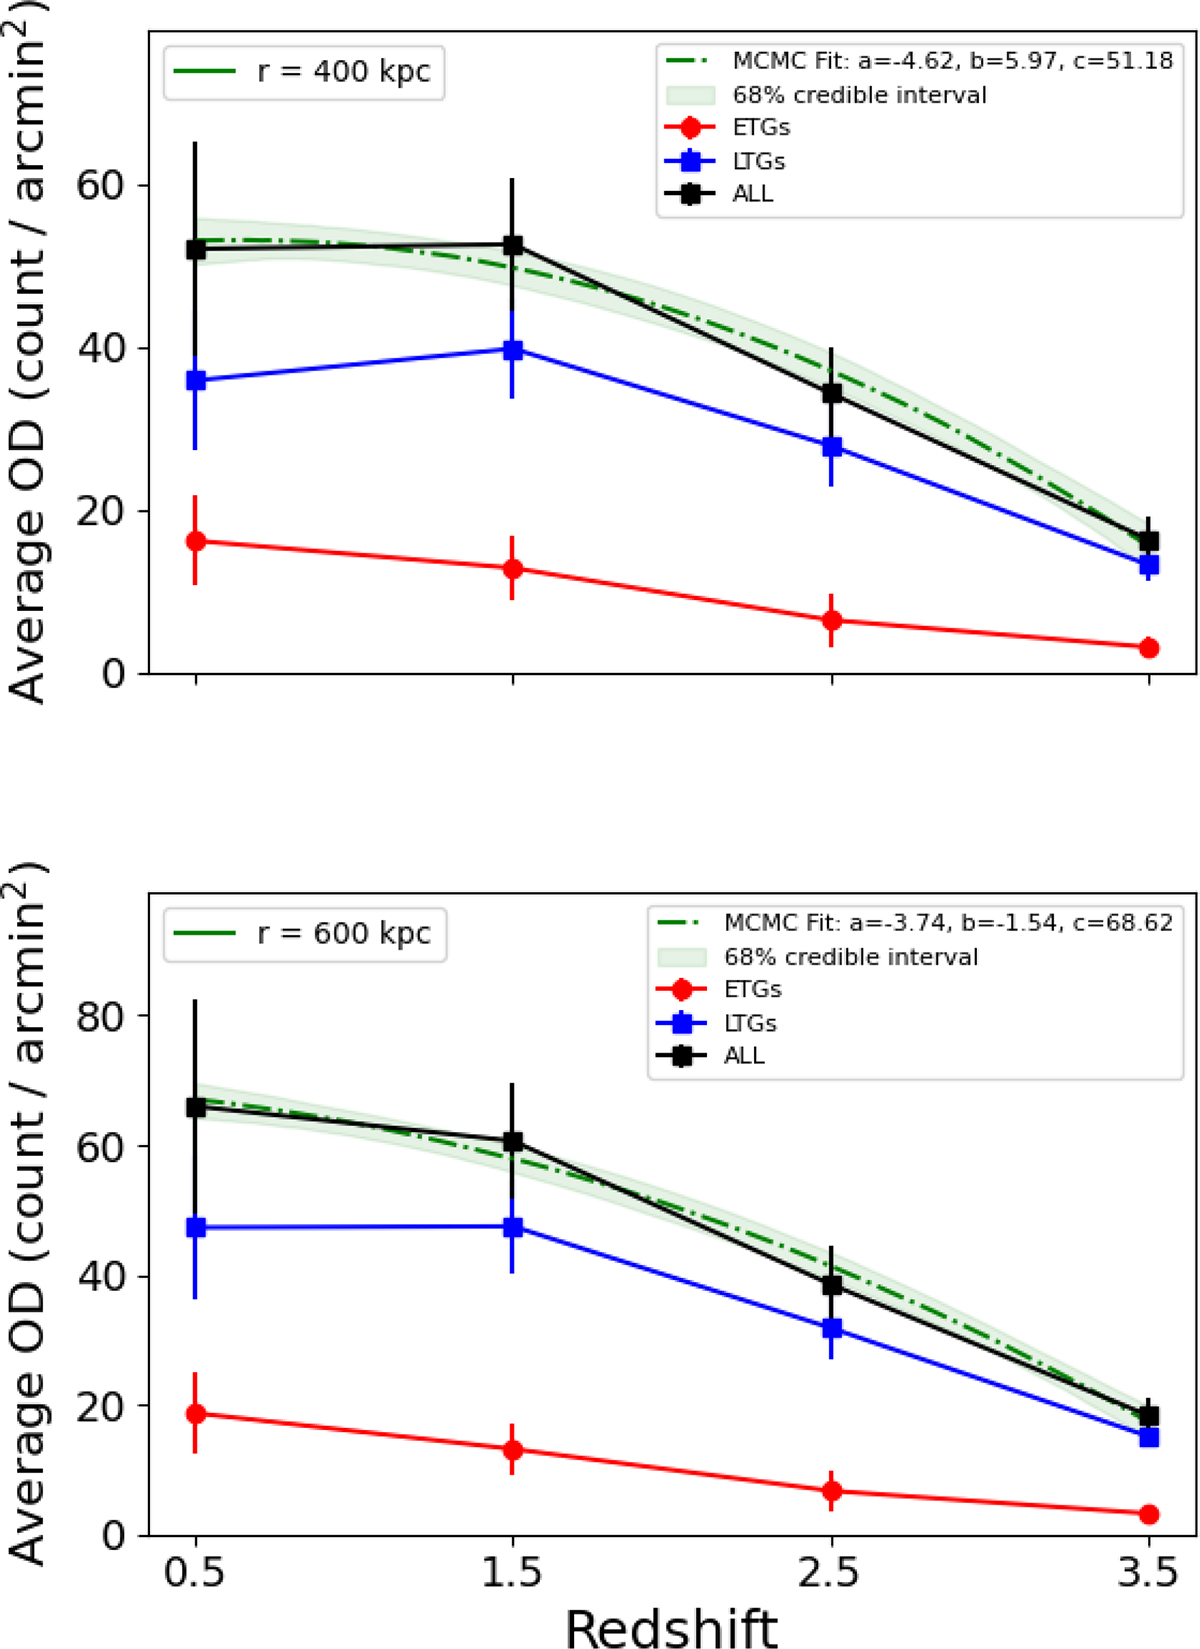
Average overdensity versus redshift for ETGs (red circles) and LTGs (blue squares), measured within cumulative apertures of 400 and 600 kpc. The MCMC fits and their 68% credible intervals are shown as dashed curves and shaded regions. These panels extend the results shown in Figure 4 for the 200 kpc aperture.
Current usage metrics show cumulative count of Article Views (full-text article views including HTML views, PDF and ePub downloads, according to the available data) and Abstracts Views on Vision4Press platform.
Data correspond to usage on the plateform after 2015. The current usage metrics is available 48-96 hours after online publication and is updated daily on week days.
Initial download of the metrics may take a while.