| Issue |
A&A
Volume 708, April 2026
|
|
|---|---|---|
| Article Number | A129 | |
| Number of page(s) | 18 | |
| Section | Extragalactic astronomy | |
| DOI | https://doi.org/10.1051/0004-6361/202558283 | |
| Published online | 01 April 2026 | |
Star formation quenching precedes morphological transformation in COSMOS-Web’s richest galaxy groups
1
INAF Osservatorio Astronomico di Trieste, Via G.B. Tiepolo 11 e Via Bazzoni 2, 34100, Trieste, Italy
2
IFPU: Institute for Fundamental Physics of the Universe, Via Beirut, 2, 34151, Trieste, Italy
3
Department of Computer Science, Aalto University, PO Box 15400, Espoo, FI-00076, Finland
4
Department of Physics, University of Helsinki, P. O. Box 64, FI-00014, Helsinki, Finland
5
University of Bologna – Department of Physics and Astronomy “Augusto Righi” (DIFA), Via Gobetti 93/2, I-40129, Bologna, Italy
6
INAF – Osservatorio di Astrofisica e Scienza dello Spazio di Bologna, Via Gobetti 93/3, 40129, Bologna, Italy
7
Zentrum für Astronomie, Universität Heidelberg, Philosophenweg 12, 69120, Heidelberg, Germany
8
ITP, Universität Heidelberg, Philosophenweg 16, 69120, Heidelberg, Germany
9
Department of Physics and Astronomy, University of California, Riverside, 900 University Avenue, Riverside, CA, 92521, USA
10
Laboratory for Multiwavelength Astrophysics, School of Physics and Astronomy, Rochester Institute of Technology, 84 Lomb Memorial Drive, Rochester, NY, 14623, USA
11
INFN – Sezione di Bologna, Viale Berti Pichat 6/2, 40127, Bologna, Italy
12
CEA, Université Paris-Saclay, Université Paris Cité, CNRS, AIM, 91191, Gif-sur-Yvette, France
13
Ruhr University Bochum, Faculty of Physics and Astronomy, Astronomical Institute (AIRUB), 44780, Bochum, Germany
14
The University of Texas at Austin, 2515 Speedway Blvd Stop C1400, Austin, TX, 78712, USA
15
Aix Marseille Univ, CNRS, LAM, Laboratoire d’Astrophysique de Marseille, Marseille, France
16
Department of Physics, University of California, Santa Barbara, CA, 93106, USA
17
Cosmic Dawn Center (DAWN), Denmark
18
Department of Physics and Astronomy, University of Kentucky, 505 Rose Street, Lexington, KY, 40506, USA
19
Space Telescope Science Institute, 3700 San Martin Drive, Baltimore, MD, 21218, USA
20
Institut d’Astrophysique de Paris, UMR 7095, CNRS, and Sorbonne Université, 98 bis boulevard Arago, 75014, Paris, France
21
Purple Mountain Observatory, Chinese Academy of Sciences, 10 Yuanhua Road, Nanjing, 210023, China
22
Jet Propulsion Laboratory, California Institute of Technology, 4800 Oak Grove Drive, Pasadena, CA, 91109, USA
23
Department of Astronomy and Astrophysics, University of California, Santa Cruz, 1156 High Street, Santa Cruz, CA, 95064, USA
24
Niels Bohr Institute, University of Copenhagen, Jagtvej 128, 2200, Copenhagen, Denmark
25
University of Geneva, 24 rue du Général-Dufour, 1211, Genève 4, Switzerland
26
Department of Astronomy, University of Washington, Seattle, WA, 98195, USA
★ Corresponding author: This email address is being protected from spambots. You need JavaScript enabled to view it.
Received:
27
November
2025
Accepted:
26
January
2026
Abstract
We analyzed the 25 richest galaxy groups in COSMOS-Web across the redshift range z = 0.18–3.65, identified using the Adaptive Matched Identifier of Clustered Objects (AMICO) algorithm. The groups have about 20–30 galaxies with a high (> 75%) membership probability. Our study reveals both passive-density and active-density relations, with late-type galaxies (LTGs) preferring both higher central overdensities than early-type galaxies (ETGs) across all groups, and secondly many massive LTGs have colors typical for quiescent galaxies. We identify red sequences (RS) in five out of 25 galaxy groups, prominently established at z < 1, with early emergence in the RS locus up to z ∼ 2.2. Although LTGs outnumber ETGs, ETGs are quenched much more efficiently than LTGs up to z ∼ 3.5. This finding suggests that group environments represent a transitional phase where star formation quenching precedes morphological transformation, contrasting with the classical morphology–density relation observed in rich clusters. In the central regions of the identified groups, within a radius of ∼33″ (100 kpc) from the group centers, we identified 86 galaxies. Among them, 23 (∼27%) were classified as ETGs and 63 (∼73%) as LTGs. High-mass galaxies (M★ > 1010.5 M⊙) undergo rapid, transformative quenching over ∼1 Gyr, becoming predominantly spheroidal ETGs, indicating that morphological transformation accelerates dramatically in the most massive systems during the epoch of peak cosmic star formation. Intermediate-mass galaxies (109 < M★/M⊙ < 1010.5) show mild quenching, while low-mass galaxies (M★ < 109 M⊙) remain largely star-forming, with environmental processes gradually suppressing star formation without destroying disk structures, suggesting that environmental quenching in groups operates on longer timescales than mass quenching. Overall, mass-dependent quenching dominates at the high-mass end, while environment-driven quenching shapes lower-mass systems, highlighting the dual nature of galaxy evolution across cosmic time. The fraction of high−luminosity active galactic nuclei (HLAGN) for both group and field galaxies increases with redshift, peaking at z ∼ 2, with groups consistently showing a higher AGN fraction than field. We suggest that AGN feedback plays a partial role in the rapid cessation of star formation in high-mass galaxies, while mergers may contribute to triggering AGN activity.
Key words: galaxies: clusters: general / galaxies: evolution / galaxies: formation / galaxies: groups: general / galaxies: high-redshift / galaxies: star formation
© The Authors 2026
 Open Access article, published by EDP Sciences, under the terms of the Creative Commons Attribution License (https://creativecommons.org/licenses/by/4.0), which permits unrestricted use, distribution, and reproduction in any medium, provided the original work is properly cited.
This article is published in open access under the Subscribe to Open model. This email address is being protected from spambots. You need JavaScript enabled to view it. to support open access publication.
1. Introduction
The cosmic structure grows in a hierarchical bottom-up fashion: small dark matter halos collapse first at high redshift and, through successive mergers and accretion, assemble into the massive halos we observe today (Springel 2005). The evolving halo mass function implies that, in the present Universe, the bulk of the mass density is contained within halos of about 1013 M⊙, the scale of galaxy groups. These groups therefore act as the fundamental building blocks of large-scale structure (LSS) and as laboratories in which environmental processes govern galaxy evolution. The properties of galaxies remain tightly coupled to their surrounding dark matter halos, particularly the most massive systems that dominate their local potential wells (Navarro et al. 1997; Dekel et al. 2009). Findings from prolonged studies indicate that fossil-progenitor luminosity functions and evolving magnitude gaps already encode accelerated assembly, underscoring the dynamical maturity of rich environments (Gozaliasl et al. 2014a,b).
The connection between star formation activity and environment is a key aspect of galaxy evolution (Alberts & Noble 2022), with observational work across the local Universe reinforcing this picture. In the local Universe, star formation rates (SFRs) correlate with both galaxy stellar mass and local density: massive galaxies in dense environments are typically red and passive, while lower-mass galaxies retain star formation (Kauffmann et al. 2004; Baldry et al. 2006; Boselli & Gavazzi 2006; Peng et al. 2010, 2012; Kawinwanichakij et al. 2017). Studies of the Coma Supercluster show systematic changes in galaxy properties from voids to filaments, groups, and clusters, suggesting increasingly divergent evolutionary pathways as a function of environment (Cybulski et al. 2014; Gavazzi et al. 2010; Mahajan et al. 2010). Recent COSMOS connectivity measurements further demonstrate that the location of groups within the cosmic web modulates their mass-assembly histories, strengthening the link between environment and galaxy evolution (Darragh Ford et al. 2019; Taamoli et al. 2024).
In dense environments such as galaxy clusters and groups, galaxies exhibit suppressed SFRs, leading to a higher fraction of red sequence galaxies and more elliptical morphologies compared to field galaxies (Dressler 1980; Postman & Geller 1984; Whitmore et al. 1993). This gives rise to well-established correlations, including the SFR–density and morphology–density relations (Oemler 1974; Dressler 1980), linking local galaxy density to typical galaxy properties. Studies using large samples, such as the Galaxy Zoo project (Bamford et al. 2009), show that galaxy color responds more rapidly to environment than morphology: high-mass galaxies are mostly red across all environments, while low-mass galaxies transition from blue in low-density regions to red in dense regions. This indicates that environmental factors affect galaxy color more quickly than morphological changes, highlighting the distinct color–density and morphology–density relations (Crossett et al. 2013). Interestingly, at z ∼ 1, this relation has been reported to reverse, with galaxies in denser regions exhibiting higher SFRs rather than lower (Cucciati et al. 2006; Elbaz et al. 2007; Patel et al. 2009), although the persistence of this reversal remains a subject of debate in subsequent studies (Grützbauch et al. 2011; Popesso et al. 2011; Ziparo et al. 2014). This reversal challenges models that predict such behavior only at earlier epochs (z > 2) and lower intensity (Sazonova et al. 2020; Mei et al. 2023), indicating that enhanced star formation in dense environments is not solely merger-driven.
Environment-driven quenching also evolves with redshift. At z < 1, environmental quenching dominates in clusters and groups, with higher environmental quenching efficiencies (EQEs) in massive halos and cluster cores, while lower-mass galaxies and outskirts retain star formation (Wetzel et al. 2012; Muzzin et al. 2013; Balogh et al. 2014, 2016; van der Burg et al. 2018; Pintos-Castro et al. 2019; Reeves et al. 2021; Sarron & Conselice 2021). An EQE depends on the halo mass, the cluster-centric distance, and sometimes the stellar mass (Papovich et al. 2018; Werner et al. 2022; Kawinwanichakij et al. 2017). At higher redshifts (z ∼ 1–2), quenching becomes more complex. Some clusters host quenched populations, others have vigorous star formation (Cooke et al. 2016; Grützbauch et al. 2012; Newman et al. 2014; Quadri et al. 2012; Santos et al. 2013; Stalder et al. 2013; Strazzullo et al. 2013). Massive galaxies (log M★/M⊙ ≳ 10.85) are mostly quenched, while lower-mass systems remain star-forming (Lee-Brown et al. 2017; Nantais et al. 2017). Observations indicate a rapid increase in EQE over ≲1 Gyr in intermediate-redshift clusters (z ∼ 1.3), consistent with a “delayed-then-rapid” quenching scenario (Wetzel et al. 2013; Foltz et al. 2018; Baxter et al. 2023). Cluster-to-cluster variation is intrinsic rather than due to selection effects (Strazzullo et al. 2019). Detailed investigations of brightest group galaxies (BGGs) across COSMOS strengthen this picture, charting their stellar masses, star-formation histories, stellar ages, and dynamical states as they migrate through quenching channels (Gozaliasl et al. 2016, 2018, 2019. 2020, 2024, 2025).
Physical processes driving quenching include external mechanisms–tidal interactions, mergers, harassment, and gas stripping (e.g., ram pressure)–and internal mechanisms such as active galactic nuclei (AGN) feedback (Gunn & Gott 1972; Larson et al. 1980; Dressler 1980; Moore et al. 1996; Poggianti et al. 1999; Boselli & Gavazzi 2006; Peng et al. 2010; Jaffé et al. 2015; Cortese et al. 2021; Boselli et al. 2022). At z > 1, quenching is mainly due to gas exhaustion with minor gas stripping, while massive satellites experience a delay ∼2 Gyr before rapid SFR decline; lower-mass satellites quench more gradually (Balogh et al. 2016; Foltz et al. 2018; Baxter et al. 2023). By z < 1, environmental quenching is more efficient, with pre-processing in groups and starvation dominating for low-mass galaxies (Wetzel et al. 2013; Bianconi et al. 2018; Olave-Rojas et al. 2018; Werner et al. 2022; Zabelle et al. 2023).
Active galactic nuclei powered by supermassive black holes (SMBHs) regulate star formation in massive galaxies by heating the hot intragroup or intracluster medium (IGrM or ICM) and suppressing cooling flows (McNamara & Nulsen 2007; Fabian 2012). Feedback strongly shapes the gas properties of groups and clusters (Eckert et al. 2021), as outflows and jets inject energy into the surrounding medium, preventing efficient cooling and star formation (Gitti et al. 2012; Gaspari et al. 2020). While early studies of groups lagged behind clusters due to lower X-ray surface brightness (McNamara & Nulsen 2007), more recent work has revealed IGrM cavities and quantified jet powers of 1041–1044 erg s−1 (Cavagnolo et al. 2010; Dong et al. 2010; Shin et al. 2016; O’Sullivan et al. 2017; Kolokythas et al. 2019), with roughly one third of X-ray luminous groups hosting central AGN activity (O’Sullivan et al. 2017). Radio surveys further confirm that group and cluster centers preferentially host AGN, with central galaxies twice as likely as non-centrals to host radio-mode AGN out to z > 1 (Best et al. 2007; Lin & Mohr 2007; Smolčić et al. 2011; Dunn & Fabian 2006; Kolokythas et al. 2019). Feedback in groups is less efficient than in clusters, avoiding over-heating while still capable of displacing gas from cores (Best et al. 2007; Giodini et al. 2009). The AGN can either suppress star formation by removing or heating cold gas, or briefly trigger it via gas compression, caused by AGN-driven outflows or jets (e.g., Sijacki et al. 2007). They follow a self-regulated cycle in which IGrM condensation triggers recurrent jets and outflows, stabilizing the system over Gyr timescales. Thus, the thermal evolution of the IGrM is closely linked to the intertwined feeding and feedback processes (Gaspari et al. 2016, 2020). Consequently, quantifying the number and spatial distribution of AGN and radio galaxies is a major line of research, revealing that group and cluster centers are special locations for AGN (Best et al. 2005; Scoville et al. 2007; Falder et al. 2010; Smolčić et al. 2011; Wylezalek et al. 2013; Ghaffari et al. 2017; Magliocchetti et al. 2018; Ghaffari et al. 2021; Vardoulaki et al. 2024). The relative importance of these processes continues to be explored through both observations and simulations (Heckman & Best 2014; Harrison 2017; Sabater et al. 2019). A puzzling result by Ghaffari et al. (2017, 2021) is that for at least 50% of radio-loud AGN (RLAGN) at z > 1, such as the 3C radio galaxies and quasars, a clear projected spatial overdensity of red galaxies has been found, typical for a galaxy group (see also Wylezalek et al. (2013) for other RLAGN samples); however, red sequences (RS) essentially escaped detection or appear blurred in color-magnitude diagrams (CMDs) despite small photometric errors Ghaffari et al. (2021); see also Kotyla et al. (2016) for a detailed RS investigation). This suggests that these high-z clusters or groups of galaxies have already assembled (or are in the assembling phase), but their members, even when showing red colors typical for quiescent galaxies, still have active star formation strong enough to disturb a clear red sequence as identified in clusters at lower redshift (z < 1); see Gladders & Yee (2000). Even for COSMOS-Web groups, the red sequences identified so far show a rather large dispersion (see Toni et al. 2026). While the morphological distinction of the high-z 3C sources into early-type galaxies (ETGs) and late-type galaxies (LTGs) by Kotyla et al. (2016) relied on Hubble Space Telescope (HST) snapshot images, COSMOS-Web provides superb data. With the in-depth multi-filter data from James Webb Space Telescope (JWST), we can now enhance the typical UVJ color selection of quenched galaxies by incorporating morphological measurements obtained through multiple methods. This combined approach offers a promising way to shed light on the evolution of ETGs and LTGs in dense environments.
The plan of this paper is as follows. We present our data and the selection of galaxy groups in Sects. 2 and 2.4, respectively, while the characterization of the group environments is discussed in Sect. 3. The AGN fraction and its potential impact on massive galaxy quenching are examined in Sect. 3.3. The predicted properties of the red sequence are described in Sect. 3.4. The evolution of quenching across different stellar mass bins at both low and high redshift is analyzed in Sect. 3.5. Finally, we summarize our findings in Sect. 4. Throughout this work, we adopt a cosmology with H0 = 70 km s−1 Mpc−1, Ωm = 0.3, and ΩΛ = 0.7.
2. Data
The Cosmic Evolution Survey (COSMOS) maps galaxy, AGN, and dark matter evolution across 0.5 < z < 6 over 2 deg2 with deep multiwavelength imaging and spectroscopy from X-ray to radio, including high-resolution HST observations, providing unprecedented galaxy samples and reducing cosmic variance (Scoville et al. 2007; Koekemoer et al. 2007; Taniguchi et al. 2007; Finoguenov et al. 2007; Capak et al. 2007; Lilly et al. 2007; Smolčić et al. 2007; Caputi et al. 2008; Kocevski et al. 2009; McCracken et al. 2012; Lemaux et al. 2014; Cucciati et al. 2014; Casey et al. 2015; Diener et al. 2015; Hung et al. 2016; Hasinger et al. 2018). Public COSMOS photometry spans more than 30 bands from UV to infrared, enabling accurate photometric redshifts and galaxy properties for ∼1 million sources, consistently derived using the LE PHARE code (Capak et al. 2007; Ilbert et al. 2006, 2009; Casey et al. 2015; Laigle et al. 2016; Liu et al. 2018).
2.1. COSMOS-Web Survey and COSMOS2025 catalog
COSMOS-Web is a JWST treasury program imaging 0.54 deg2 with NIRCam in the F115W, F150W, F277W, and F444W filters to 5σ depths of 27.5–28.2 mag, and mapping 0.19 deg2 with MIRI F770W to 25.3–26.0 mag (Casey et al. 2023; Franco et al. 2025; Harish et al. 2025), providing homogeneous high-resolution coverage for group analyses. The COSMOS2025 catalog delivers photometric redshifts, morphologies, and physical parameters for > 7 × 10⁵ galaxies, using hybrid fixed-aperture and profile-fitting photometry in 37 bands (0.3–8 μm). Photometric redshifts reach σMAD/(1 + z) = 0.012 with an outlier fraction η < 2% for mF444W < 28 to z ∼ 9, representing a factor of ∼2 improvement over COSMOS2020 at mF444W ≈ 26, remaining below 0.03 over a wide range of magnitudes, with ≳80% completeness for log(M★/M⊙)≈9 at z ∼ 10 and better than 109 M⊙ for all z < 4 (Shuntov et al. 2025). Stellar masses and star-formation rates adopt CIGALE (Boquien et al. 2019) modeling from Arango-Toro et al. (2025), fitting star-formation histories calibrated with Horizon-AGN using Bruzual & Charlot templates (Bruzual & Charlot 2003) and fixed dust emission/attenuation (Calzetti et al. 2000; Dale et al. 2014), producing consistent M★–SFR relations without AGN torus components. To capture rest-frame optical morphologies and the 4000 Å break, JWST photometry is complemented with HST/ACS F814W imaging (Koekemoer et al. 2007) and Subaru Hyper Suprime-Cam imaging (Taniguchi et al. 2007). COSMOS-Web structural measurements (Yang et al. 2025) use the Python package Galight (Ding et al. 2020)1, revealing that star-forming galaxies maintain roughly constant size–mass and surface density relations, while quiescent systems show steeper structural scaling and a compactness threshold at log Σ* ∼ 9.5–10 M⊙ kpc−2.
2.2. VLA-COSMOS data
The VLA-COSMOS 3 GHz Large Project (Delvecchio et al. 2017) supplies deep radio continuum imaging and source classifications out to z ≲ 6, enabling us to trace radio-mode AGN associated with COSMOS-Web groups. AGN identifications are based on a three-component spectral energy distribution (SED) decomposition (Berta et al. 2013; Feltre et al. 2012) that compares fits with and without a torus contribution (via Multi-wavelength Analysis of Galaxy Physical Properties, MAGPHYS; da Cunha et al. 2008) and adopts the AGN solution when the improvement exceeds the 99% confidence level.
2.3. COSMOS spectroscopic redshift catalog
Khostovan et al. (2026) present a compilation of ∼488 000 spectroscopic redshifts for 266 000 galaxies over 20 years in the COSMOS field, covering a wide range of masses and redshifts up to z ∼ 8. The compilation is primarily complete for low- to intermediate-mass star-forming and massive quiescent galaxies at z < 1.25, and low-mass star-forming galaxies at z > 2.
2.4. COSMOS-Web group catalog
COSMOS-Web galaxy groups (Toni et al. 2024, 2025) are identified with the AMICO matched-filter algorithm (Bellagamba et al. 2018; Maturi et al. 2019), which treats galaxies as a clustered signal atop a field background and assigns probabilistic memberships. Catalog columns include ID, RA, Dec, redshift (Z), the detection signal-to-noise (S/N) value (SN_NO_CLUSTER) without cluster shot-noise contribution, which serves as the primary indicator of detection significance and sample purity, the intrinsic richness λ* (LAMBDA_STAR) defined as the sum of membership probabilities for galaxies within R200 with m ≤ m* + 1.5 (with parameters given by the detection model), and the probabilities of being associated with a group or with the field (ASSOC_PROB and FIELD_PROB, respectively). For further details on these quantities, we refer the reader to Toni et al. (2025). The group search relies on masks based on the Gaia DR2 visibility mask and bright stars (G < 18), and residual imaging artifacts are removed by testing and visual inspection (Toni et al. 2024, 2025). Applying these criteria yields a total of 1678 detections above 0.45 deg2, down to a detection threshold of S/N = 6. Throughout the analysis, we refer to the AMICO centroid as (RADET, DecDET, zDET) and use these values when cross-matching photometric and spectroscopic measurements. The effect of the masked area is already taken into account, following the same correction procedure described in Toni et al. (2025).
We characterize the richest groups in each redshift bin by cross-matching AMICO group members with the COSMOS-Web Master Catalog v3.1.0 (Shuntov et al. 2025), from which we obtain redshifts and colors. Stellar masses and SFRs are then supplemented using the catalogs of Arango-Toro et al. (2025), and Sérsic indices are taken from Yang et al. (2025).
3. Galaxy group environments
We identified spectroscopic group members by selecting all sources within a projected radius of 800 kpc from each group center and applying a redshift-dependent cut of ±0.01(1 + zCL). Reliable redshifts: secure measurements with flag = 3, 4, 13, 14 and moderate-confidence measurements with flag = 2, 12 when their confidence level is 80%2. For each group, we counted secure and total matches, which are listed in Table A.1.
To preserve uniform quality, we impose the following selection criteria:
-
Apply a magnitude cut of MAG_MODEL_F444W < 27.2 (Average fraction removed: 16% (min ∼ 2%, max ∼ 30%)) to remain within the ∼95% completeness limit established in Appendix C and to exclude sources with poorly constrained photometry.
-
The best photo-z quality flags (LP_warn_fl = 0) are considered, because we are using the AMICO membership catalog, which already accounts for this.
3.1. Morphology of galaxy group members
We used structural measurements from Yang et al. (2025) to classify galaxies into ETGs and LTGs to study their evolution from star-forming to quiescent states. Morphological classification is based on the Sérsic index (Sersic 1968), with galaxies having nS < 2.5 classified as LTGs and nS ≥ 2.5 as ETGs (van der Wel et al. 2014). To ensure consistent rest-frame optical sizes across redshift, we adopt the NIRCam filter closest to ∼8000 Å, minimizing biases from star formation and dust (Gozaliasl et al. 2025), using F115W (0.05 < z ≤ 0.4), F150W (0.4 < z ≤ 1.0), F277W (1.0 < z ≤ 3.0), and F444W (3.0 < z ≤ 4.0).
3.2. Selection of rich groups
Figure 1 shows a hexbin map of intrinsic richness (λ★) versus redshift for AMICO detections. The color of each hexagonal bin represents the median value of S/N (e.g., SN_NO_CLUSTER) of the groups it contains. For selection, the galaxy group sample was binned into 19 redshift intervals, each with a width of Δz = 0.2, spanning 0 < z < 3.8. Within each redshift bin, we first identified the two groups with the highest intrinsic richness and S/N, yielding a sample of 38 galaxy groups. From these, we further selected 25 groups that display a symmetric annular distribution of photometric redshift–selected galaxy members within a physical scale of 1 Mpc around the group center (RADET, DecDET). The redshift values for the sample range from 0.18 to 3.65, with S/N values varying from 12.59 to 43.11, and richness values ranging from 10.81 to 77.57. The galaxy groups selected for comparison are listed in Table A.1 and marked with purple hexagons in Fig. 1. The increasing trend of intrinsic richness observed up to redshift z ∼ 2 is expected, as the detection of less-rich groups becomes increasingly difficult at higher redshifts. At z ≳ 2, numerous low-λ★ detections may be attributed to the fact that AMICO is likely to detect the cores and substructures of clumpy extended protostructures rather than individual virialized groups.
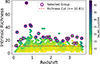 |
Fig. 1. Intrinsic richness λ★ versus redshift (hexbin map) for the COSMOS-Web AMICO detections. Each bin is colored by the median SN_NO_CLUSTER, the dashed red line marks the richness threshold λ★ = 10.81, and the purple outlines highlight the 25 groups retained for detailed analysis. |
3.3. Radial surface density in rich groups
We quantify central overdensities by converting projected separations into physical radii and constructing radial surface density (RSD) profiles for ETGs and LTGs separately. Each group is divided into concentric 100 kpc annuli up to 1.4 Mpc. (The choice of 1.4 Mpc is intended to probe large-scale structure and the V-shaped RSD3, rather than the physical size of the groups.) Galaxy counts are normalized by annular area (counts arcmin−2), and the central overdensity (OD) is defined as the density within r < 200 kpc minus the local background (BCK) measured by the local periphery (PER) between 800 and 1000 kpc. The average global background is ∼0.2 counts arcmin−2, whereas local periphery densities reach ∼1 counts arcmin−2 and typically exceed the global value by factors of 3–5; subtracting this local PER minimizes contamination from fore- and background sources in each group. The catalog of COSMOS-Web groups by Toni et al. (2025) lists all potential candidate group member galaxies and, for each galaxy, provides an association probability (assoc_prob) and a field probability. Many galaxies, however, have relatively low assoc_prob values (< 0.5), and galaxies with large photometric redshift uncertainties (σz > 0.1) also enter the catalog. Although σz and assoc_prob are not simply correlated, the galaxies with the largest σz show the lowest assoc_prob. To select only the most reliable members, we applied a narrow redshift threshold ±0.01(1 + zDET) and verified the robustness of each group through the emergence of the RS, as discussed in Section 3.4. This approach allows us to assess the reliability of the detected systems and to reduce potential spurious detections and mis-centering effects, which are expected in low-density regions when applying a relatively low S/N threshold of 10. Fig. 2 as an example illustrates the member distribution workflow for group ID 4. The left panel shows the redshift distribution of AMICO candidates with the adopted window ±0.01(1 + zDET) around zDET (green dashed lines); the middle panel maps projected positions and morphological types (blue LTGs, red ETGs) in concentric annuli, including matched HLAGN whose redshift offsets are color-coded; the right panel presents the resulting RSD profile. We rely on spatial and redshift proximity rather than the full AMICO probability distribution to limit spurious associations. We selected galaxy members within a spatial radius of 800 kpc from the catalog’s center (RADET and DecDET) and within a redshift range of ±0.01 (1 + zDET). We then applied the redshift-dependent mass cut described in Appendix D to the remainder of our analysis. Notice that group ID 304 required a recentering because the catalog’ center (RADET, DecDET) did not trace the dynamical core. We therefore computed a stellar-mass-weighted barycenter, shifting the coordinates by 1.47′ east and 2.13′ south, which restored the expected central overdensity:
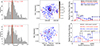 |
Fig. 2. Member-selection diagnostics for group ID 4. Left: redshift distribution of AMICO candidates. The red solid line and hatched region (bounded by green lines) represent zDET and the adopted selection window Δz = ±0.01(1 + zDET), respectively. Middle: projected distribution of LTGs (blue) and ETGs (red) in concentric annuli, with galaxies having assoc_prob > 0.5 shown as filled circles and those with assoc_prob ≤ 0.5 as unfilled circles; matched HLAGN are marked as stars colored by |zAGN − zDET|. Right: radial surface density profile showing ETG, LTG, and combined overdensities after subtracting the local background (PER). Panels in the bottom row repeat the analysis for high field-probability galaxies (e.g., FIELD_PROB > 0.7). Negative values indicate underdensities, where the accumulated density minus the outskirts baseline becomes negative. |
Across all 25 systems, none show ETG overdensities surpassing those of LTGs, indicating that group cores remain dominated by gas-rich disks. The RSD for ETGs, LTGs, and the combined sample (All) are shown in the right panel of Fig. 2 and Table A.1, with the corresponding calculations (OD, PER, BCK) annotated in the figure. The same plot for a subsample (group IDs: 15, 1, 36, 72, 30, 156) is shown in the appendix (Fig. E.1, while the remaining plots are available online via the Zenodo link4.
3.3.1. Size−redshift relation in rich groups
Rcut is the projected physical radius (in kpc) where the group’s RSD profile flattens to the background level, representing the effective physical size of the system. Fig. 3 summarizes the RSD-derived Rcut values for the 25 groups. Gray data points represent the individual, with error bars reflecting the local standard deviation in Rcut. The robust Markov Chain Monte Carlo (MCMC) fit to this raw dataset reveals a steady decline in characteristic size with increasing redshift (dashed black line). This trend mirrors the mass–observable evolution reported by Grandis et al. (2024) for clusters and is consistent with the expectation that higher-redshift groups are less massive and therefore more compact.
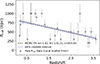 |
Fig. 3. Average radius Rcut as a function of redshift. Blue points show binned means with Poisson errors, and the dashed curve denotes the quadratic fit Rcut = −1.62z2 − 132.21z + 819.84 kpc. |
3.3.2. Central regions of rich groups ( < 100, 200 kpc)
Stacking overdensities within a 200 kpc aperture shows that LTGs maintain higher central densities than ETGs across most redshifts (Fig. 4); results for larger apertures (400 and 600 kpc) are presented in Appendix B.1. ETG overdensities decrease from z ∼ 1 to z > 2, while, over the same interval, LTG overdensities show a slight increase, highlighting the continued prevalence of star-forming disks in group cores. Unlike the purely passive-density relation seen in massive clusters (Mei et al. 2023), our groups display concurrent passive- and active-density trends, consistent with gentler potentials that allow LTGs to linger and quench more gradually. Within r < 100 kpc we identify 86 members in the 25 groups, of which 63 (73%) are LTGs and 23 (27%) are ETGs. The richest cores host up to seven galaxies (IDs 4, 36), whereas one system (ID 14) lacks any central members. Groups with five or more central galaxies exhibit central overdensity (COD) values spanning ∼4 to ∼70 counts arcmin−2, reflecting the diversity of dynamical states. In several cases, the AMICO centroid aligns with an average of multiple density peaks rather than the deepest potential minimum, especially in unrelaxed or lower-mass halos (Toni et al. 2025).
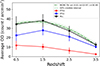 |
Fig. 4. Average overdensity versus redshift for ETGs (red circles) and LTGs (blue squares), and their sum (black), measured within cumulative apertures of 200 kpc. Error bars denote the standard error of the mean, while the dashed curve and shaded regions show the MCMC fit and its 68% credible interval for the combined population. Average overdensity of field galaxies is consistent with a constant background level. |
3.3.3. AGN fraction for all groups
We identify HLAGN (LX ≳ 1044 erg s−1) counterparts within ±0.05 × (1 + zDET) of each full sample (∼1678) group’s redshift5 and measure their projected distance from the group center to classify sources as central (r < 0.2 Mpc) or outskirts (0.2 < r < 1.0 Mpc). Fractions are computed using only groups that contribute at least one galaxy to the relevant radial bin, ensuring consistent normalization of NAGN, Ngal, and Ngroup. Table 1 and Fig. 5 show that HLAGN is slightly more concentrated in the central regions at z < 1 (2.4% versus 1.4%), while at z > 1 the fractions of the outskirts increase to ∼2% and exceed or match the central values. AGN activity therefore transitions from being core-dominated at low redshift to being more broadly distributed at higher redshift, consistent with an increased supply of cold gas in the outer group environment near cosmic noon.
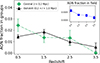 |
Fig. 5. Fraction of HLAGN as a function of redshift for central (r < 0.2 Mpc) and outskirt (0.2 < r < 1.0 Mpc) regions. Points show the combined group sample with Poisson uncertainties. |
Average AGN fraction for COSMOS-Web groups in central and outskirt regions.
There are a total of 15 HLAGN across the nine richest galaxy groups sample. The closest to the center AGN is in the ID group 118 at z = 2.490, with a distance of ∼72 kpc. The farthest HLAGN is in group ID 82 at z = 2.9, with a distance of ∼805 kpc.
-
High Redshift (z > 1): This category shows a wide range of locations. It contains the most centrally located AGN in the entire sample (Group 118 at ∼72 kpc) as well as several AGN found in the outskirts (e.g., Groups 7, 121, and 82, with distances up to ∼805 kpc).
-
Low Redshift (z < 1): Most AGN in this category are located on the outskirts of their host Groups. There are a few exceptions with relatively central locations, such as the AGN in Groups 1 and 4, in ∼131 kpc and ∼123 kpc, respectively.
Of the 15 HLAGN identified, five are located in the central regions of their respective galaxy groups: 118 (∼72 kpc), 7 (∼104 kpc), 4 (∼123 and ∼177 kpc; 2×), and 1 (∼131 kpc). HLAGN populates both the central and outer regions of groups across all redshifts. The fraction peaks near z ∼ 2, coincident with cosmic noon when abundant cold gas and frequent interactions funnel material toward supermassive black holes. The subsequent decline toward z < 1 implies dwindling fuel supplies and more effective feedback, although gas can still be retained in dense cores where close encounters and mergers recycle the stripped material, sustaining residual activity.
3.3.4. Large scale structure classification in rich groups
To quantify the environmental dependence of galaxy groups, we cross-matched the COSMOS-Web richest group catalog with the Taamoli et al. (in prep.) large-scale structure (LSS) classification, identifying systems residing in clusters, filaments, and the field. Taamoli measured the mean density contrast, accounting for the local background and for masked regions around bright sources, ensuring consistent sampling across environments. The resulting normalized densities were then compared across the three LSS categories to trace how the signal varies from the densest cluster cores to the more diffuse field regions (Taamoli et al., in prep.).
Cluster-like systems (LSS_Flag = 2) have a mean radius of ∼592 kpc, filaments (LSS_Flag = 1) average ∼475 kpc, and field-like associations (LSS_Flag = 0) extend to ∼250 kpc, reinforcing the link between environment classification and physical scale.
We further stack groups within each category and normalize the profiles to the densest system in our sample, highlighting a clear gradient in both scale and density with environment. Groups in cluster-like regions exhibit the highest normalized mean densities, while filamentary systems bridge the transition toward the field population (Fig. 6). The average density decreases steadily from clusters to filaments and to the field, consistent with previous findings that link galaxy density to cosmic connectivity (Castignani et al. 2022; Cautun et al. 2014). Filaments represent environments of intermediate density between clusters and the field (Cautun et al. 2014), where in our case the greater uncertainty may be influenced by the limited sample size.
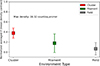 |
Fig. 6. Normalized average surface density for groups as a function of environment classification. Squares with error bars indicate the mean and uncertainty for cluster, filament, and field systems, normalized to the peak density of group ID 4. |
3.4. The Red sequence population in rich groups
To predict the red sequence locus in the CMD across redshift range 0 ≲ z ≲ 4, we construct a forward stellar population synthesis (SPS) model using Bayesian Analysis of Galaxies for Physical Inference and Parameter EStimation (Bagpipes)6 (Carnall et al. 2019). The model accounts for stellar mass, redshift, and environmental dependencies. For each of the 25 groups considered in this analysis, we define the following physical quantities: a mass–metallicity relation (MZR; Sanders et al. 2015, 2021), formation redshift (zform is the redshift at which a galaxy formed 50% of its stellar mass), star-formation history (SFH), dust emission, and filter selection. We extend the Sanders et al. (2021) MZR to include redshift evolution and environmental metallicity boosts, while maintaining consistency with local observations (Tremonti et al. 2004; Gallazzi et al. 2005). The resulting relation is
![Mathematical equation: $$ \begin{aligned} 12 + \log (\mathrm{O/H} )_{\rm custom}&= \left[\,8.69 + 0.64\, \frac{\log M_\star - 10.4}{1 + \left(10^{\log M_\star - 10.4}\right)^{-1.2}} + \Delta _z\,\right] \nonumber \\&\quad \times \mathrm {env\_boost} \end{aligned} $$](/articles/aa/full_html/2026/04/aa58283-25/aa58283-25-eq2.gif) (1)
(1)
where 8.69 is the z = 0 field-galaxy asymptotic metallicity at the turnover mass, MTO = 10.4, with 0.64 representing the low-mass slope (γ); this MTO is fixed slightly higher than the nominal value in Sanders et al. (2021) to better match massive-galaxy observations. The exponent −1.2 reproduces the smooth curvature of the transition region in a computationally convenient way, effectively replacing the Δ parameter of the original formula. The redshift evolution term Δz and the environmental boost env_boost represent the redshift evolution and environmental metallicity boosts, respectively. Redshift evolution is calibrated against high-redshift measurements (Maiolino et al. 2008; Cullen et al. 2014, 2019) and recent JWST constraints (Li et al. 2023; Curti et al. 2024; Stanton et al. 2025), with the adopted linear form summarized in Appendix F.1. This term captures the systematic decrease of metallicity with increasing redshift, reflecting both high-redshift galaxy observations and theoretical expectations for chemical enrichment across cosmic time. This formula preserves the low-mass slope, turnover mass, and curvature of the original Sanders MZR while allowing physically motivated extensions. Observations indicate that galaxies in groups and clusters are more metal-rich than field galaxies at fixed stellar mass (Pasquali et al. 2012; Peng et al. 2015). We implement this as a multiplicative boost to the metallicity, which depends on stellar mass and decreases with redshift, reflecting the reduced efficiency of environmental processing in the early Universe (Fossati 2017; Chartab et al. 2020). Field galaxies are kept as the baseline, with no enhancement. The environmental metallicity boost applied to group galaxies is described in Appendix F.1. This factor is multiplicative on the base mass–metallicity relation (Fossati 2017; Chartab et al. 2020). We incorporate the fundamental metallicity relation (Mannucci et al. 2010), ensuring consistency between stellar mass, metallicity, and star-formation rate. A primordial metallicity floor of log(O/H) = 7.5 is imposed, and abundances are expressed relative to the solar scale of Asplund et al. (2009) (12 + log(O/H)⊙ = 8.69). The galaxy formation redshift zform is assigned based on stellar mass and observation redshift following downsizing trends (Thomas et al. 2010; McDermid et al. 2015; Behroozi et al. 2013; Rodriguez-Gomez et al. 2016; Nakajima et al. 2023; Curti et al. 2024) (see Appendix F.2 for parameterization). The assigned zform is limited to zobs + 2 and is capped at ten; formation times shorter than 0.1 Gyr are avoided.
Dust attenuation for red sequence galaxies is modeled as a function of stellar mass and redshift, following observational constraints (Whitaker et al. 2017; Bouwens et al. 2016; Fudamoto et al. 2021). More massive galaxies exhibit slightly higher V-band attenuation, while attenuation increases moderately with redshift. To account for environmental effects, a small reduction is applied for galaxies in dense regions, reflecting processes such as gas stripping (see Appendix F.3 for parameterization). The resulting prescription ensures low but evolving dust levels, with an upper limit of AV = 0.3 mag, consistent with the typically quiescent nature of red sequence systems.
The age spread of red sequence galaxies is modeled through an exponentially declining SFH characterized by a timescale τ, which depends on stellar mass and redshift (Thomas et al. 2010; McDermid et al. 2015). More massive galaxies are assigned shorter τ, reflecting their rapid, early formation, while lower-mass systems have more extended SFHs. The timescale also evolves mildly with redshift, allowing slightly longer star formation at earlier epochs (see Appendix F.4 for the parameterization). A minimum value of τ = 0.05 Gyr is imposed to ensure a physically realistic evolution. This prescription captures the observed downsizing trend and provides realistic age spreads for synthetic red sequence galaxies. For each group, we generated a realistic red sequence population by sampling galaxies across a wide stellar mass range, log10(M★/M⊙) = 7.5–12.0. This range captures both low-mass satellites and the most massive central galaxies, allowing a physically motivated modeling of the red sequence. To predict observable colors, we selected filter pairs that bracket the redshifted 4000 Å break, adapting to the cluster redshift. For low-redshift clusters (zcl < 0.7), we used the Hyper Suprime-Cam (HSC) g and z bands. Intermediate redshifts (0.7 ≤ zcl < 1.4) employ HST F814W and JWST F277W filters, while higher redshifts (1.4 ≤ zcl < 4) adopt JWST F115W and F277W. This ensures that the chosen filters effectively trace the spectral feature that defines quiescent galaxies at each epoch.
The predicted location of the red sequence on the CMD for group ID 4 is shown in Fig. 7 (right panel) and for a subsample is shown in the Appendix (Fig. G.1, while the remaining plots are available online via the Zenodo link7). The orange line and pink shaded area on the CMD diagram show the predicted red sequence location at the group’s redshift zDET, with ±0.25 mag reflecting the uncertainty in color. We identified clear red sequences in five out of 25 galaxy groups, prominently established at z < 1, with early indications of RS features in three additional groups up to z ∼ 2.2. The groups with the significant ETGs and LTGs in the place of red sequence, are IDs 1(27 / 42), 35(17 / 23), 36(15 / 4), 4(8 / 3), 15(9 / 41), 304(6 / 5), 85(3 / 4), 20(4 / 2). For group ID 4, we found 11 out of 84 galaxies (∼13%) on the red sequence, where the percentage is relative to all group members. For all 25 groups we found an average fraction of ∼10% (105/1075) ETGs and ∼13.5% (145) LTGs on the red sequence. We found that 19 out of 25 groups contain fewer than five ETG galaxies in the red sequence region. Significant presence of LTGs (∼13.5%) on the red sequence is indicative of galaxies that have quenched their star formation while retaining their disk-dominated morphology. This observation is consistent with studies that track the morphological evolution of quiescent galaxies, such as Cerulo et al. (2017), who, using the HAWK-I Cluster Survey (HCS) sample at 0.8 < z < 1.5, document a ∼20% increase in the fraction of S0 galaxies on the red sequence from z ∼ 1.5 to z ∼ 0.05. These results suggest that the LTGs observed in our high-redshift groups are the progenitors actively undergoing morphological transformation into S0 galaxies as they evolve toward the present day (Cui et al. 2024; Aldás et al. 2025). Using Hyper Suprime-Cam Subaru Strategic Program (HSC-SSP) data at 0.3 < z < 0.6, Shimakawa et al. (2021) found a deficit of spiral galaxies in dense environments and clusters, consistent with the emergence of the morphology–density relation. In contrast, our COSMOS-Web groups still host a high fraction of LTGs in dense regions, suggesting we are observing an earlier stage where quenching is underway but morphological transformation has not yet taken hold. We further illustrate the locations of the ETG and LTG populations in the color–color diagram (CCD) (Fig. 7, middle panel) using empirically defined trapezoidal segments. The combination of HST optical (F814W) and JWST NIR filters (F277W, F444W) provides sufficiently broad wavelength coverage to trace the full range of galaxy colors across our redshift interval. The part that clearly depends on redshift is the horizontal line before the ankle point. This line becomes redder at higher redshift: it starts at color ≈0.5 at lower z, increases to ≈1–2 around z ∼ 1, and reaches ≈2.5 at higher redshifts, reflecting the gradual aging of stellar populations and the intrinsic evolution of galaxy colors over cosmic time. In contrast to fixed rest-frame color cuts (e.g., Ilbert et al. 2013, Fig. 3) or redshift-dependent prescriptions (e.g., Ghaffari et al. 2021, Fig. 4), this CCD-based method isolates the region where morphological transformation lags behind color quenching, allowing us to identify LTGs that maintain disk-like morphology while already exhibiting redder colors. The shaded background regions define two principal color-selected populations, each marked with corresponding red and green box outlines across all three panels. The red-shaded zone in the upper left corresponds to the quiescent population, which includes both ETGs and LTGs. The green-shaded region, located between the horizontal cut and the inclined boundary, delineates the red star-forming (RSF) population, which is primarily composed of LTGs. These same populations are highlighted in the log(SFR)–log(M★/M⊙) diagram (Fig. 7, left panel) using the same color and symbol coding as in the middle panel. Galaxies within the red box occupy the region below the main sequence (MS), approaching the fully quenched regime. In contrast, galaxies within the green box lie closer to, or just below, the MS, indicating that they remain actively star-forming despite having colors redder than those of the typical blue, star-forming population. Additional examples are shown in Fig. G.1 and available online8. Whether the observed redness is due to dust obscuration or to the onset of quenching is beyond the scope of this paper. We compute the evolution of RS galaxies by dividing the number of galaxies that lie above the red sequence minus 0.25 magnitudes (RS −0.25) in the CMD by the total number of filtered galaxies within the corresponding redshift bin. We restrict the spatial distance to 500 kpc to exclude members with probability < 0.5, while results within 800 kpc show a similar general behavior. In Fig. 8 (left), we show the mean fractions of galaxies located above RS −0.25 as a function of redshift, where ETG and LTG fractions are additive contributions to the total population (f = Ntype/NTotal). The total fraction (black line) decreases steadily from ∼40% at z ∼ 0.5 to below 15% by z ∼ 1.5. In this additive view, LTGs contribute a higher overall fraction to the RS (about 25%) than ETGs (about 17%) at z ∼ 0.5, simply because LTGs are more numerous in the total cluster sample. However, to investigate the intrinsic quenching efficiency of different morphologies, Fig. 8 (right) shows the type-wise fractions normalized by their respective sub-population totals (f = Ntype/NTotal, type). This panel reveals that ETGs are significantly more efficient at quenching than LTGs across the entire redshift range. At z ∼ 0.5, the fraction of ETGs located above RS −0.25 is approximately 75%, while only 30% of LTGs satisfy this criterion. Even at z ∼ 1.5, the ETG quenching efficiency remains high at approximately 60%, while the LTG and the sum of ETG + LTG (ALL) populations fall below 15%. By z ∼ 3.5, these efficiencies for all types converge toward lower values between 10% and 30%. This comparison highlights the distinction between population abundance and physical efficiency. While Fig. 8 (left) shows that LTGs make up a larger portion of the quenched population, Fig. 8 (right) confirms that ETGs are intrinsically more likely to be quenched than LTGs at all redshifts out to z ∼ 3.5. The fact that LTGs dominate the absolute numbers in the RS despite their lower quenching efficiency is primarily due to their significantly higher overall abundance in the cluster environment compared to ETGs.
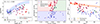 |
Fig. 7. Diagnostic diagrams for group ID 4. Left: SFR versus stellar mass with LTGs (blue squares) and ETGs (red circles); the gray cross indicates typical uncertainties and the cyan dashed line shows the Popesso et al. (2023) main sequence. Middle: rest-frame color–color diagram. Crimson dashed line segments define an empirical, trapezoidal boundary separating the galaxy population into blue star-forming, red star-forming (green-shaded), and quiescent (red-shaded) regions. To highlight the key non-blue populations, galaxies are marked on all panels with a thick green square outline (red star-forming) or a thick red square outline (quiescent). Right: color–magnitude diagram with orange line and pink shaded area marking the predicted red sequence locus at zDET ± 0.25 mag. |
3.5. Stellar mass and star formation in rich groups
Overall, the emerging picture at high redshift indicates two complementary modes of quenching: massive galaxies experience rapid, internally driven quenching, whereas lower-mass galaxies undergo delayed, environment-driven quenching as clusters assemble and virialize from z ∼ 2 to z ∼ 1. We investigate the evolution of ETGs/LTGs in Starburst, main sequence (MS), and quiescent regions across the widest redshift range (0 < z < 3.6) and stellar mass interval (107.5–1011.5 M⊙) probed to date (Fig. D.1). We apply a stellar-mass threshold of log(Mcut(z)) to define the final sample, ranging from 6.5 at z = 0 to 8.9 at z = 4.0.
The star-forming main sequence (SFMS) links galaxy stellar mass and SFR, providing a baseline to identify typical versus unusual star-forming activity. Its slope and normalization evolve smoothly with redshift, reflecting mass-dependent growth rather than stochastic events, making it a key tool to study galaxy evolution (Speagle et al. 2014). Popesso et al. (2023) compiles a comprehensive census of 64 star-forming galaxies (0 < z < 6, 108.5–1011.5 M⊙) and shows that the SFMS is best described by a two-parameter function: a redshift-dependent normalization and a turnover mass M0(t). Below M0(t), galaxies maintain a constant specific star-formation rate (sSFR), while above it the sSFR is suppressed, producing the characteristic SFMS bending. This framework links M0(t) to the transition in halo accretion modes and provides a formalism to locate ETGs and LTGs relative to the evolving SFMS:
![Mathematical equation: $$ \begin{aligned} \log _{10}(\text{ SFR})&= \left[ (0.84 \pm 0.02) - (0.026 \pm 0.003)t \right] \log _{10}(M_\star )\nonumber \\&\quad - \left[ (6.51 \pm 0.24) - (0.11 \pm 0.03)t \right] \pm 0.23 \end{aligned} $$](/articles/aa/full_html/2026/04/aa58283-25/aa58283-25-eq3.gif) (2)
(2)
where t is cosmic time. This is important to understand how these fundamental galaxy properties are influenced by the group environment as they evolve across cosmic time. To reliably separate star-forming regions in the M★–SFR plane (As shown in the left panel of Fig. 7), we define the main sequence (MS) as the locus within ±0.5 dex of the SFMS at the group’s redshift a bit wider than what is typically accepted for clusters (e.g., ±0.3 dex, Janowiecki et al. 2020; Popesso et al. 2023; Finn et al. 2023; De Daniloff et al. 2025). We define the starburst region as lying above the MS and the quiescent region as lying below it. In order to distinguish the evolution of ETGs and LTGs in different sections of SFMS, we stacked all the group members to achieve a statistically robust sample. The galaxies were then sorted into a grid of bins based on their stellar mass (High-Intermediate-Low) and redshift (Δz = 0.5). For each bin, we calculate the fraction of ETGs and LTGs for three distinct populations: MS, starburst (SB) and quiescent (Q).
3.6. Quenching and morphological evolution across mass bins
Figure 9 reveals the critical interplay between stellar mass, galaxy morphology (ETG/LTG), and star-forming galaxies across cosmic time. In the high-Mass bin (log10(M★/M⊙) > 10.5), quiescent galaxies transition from being LTG-dominated (∼50%) at high redshift (z ≈ 3.5) to ETG-dominated (∼80%) at low redshift (z ≈ 0.5). The intermediate-Mass bin (9.5 < log10(M★/M⊙) < 10.5) shows only a mild evolution: the LTG fraction decreases slightly from ∼90% to ∼75% (z = 3.5 to 0.5), corresponding to an increase in the ETG fraction from ∼0% to ∼30%. The low-Mass bin (log(Mcut(z)) < log10(M★/M⊙) < 9.5), is consistently dominated by LTGs, maintaining a fraction of ∼90% across all redshifts. The corresponding ETG fraction remains low, staying within the range of ∼10% to ∼20%.
The MS+SB LTG fraction is nearly universal (above 80%) for low- and intermediate-mass bins across all redshifts, leaving the MS+SB ETG fraction negligible (< 20%). However, the high-mass MS+SB bin exhibits a unique evolution: the LTG fraction increases significantly from ∼60% at z > 2 to ∼100% at z < 1. Correspondingly, the ETG fraction decreases sharply from ∼40% at z > 2 to nearly 0% at z < 1. Based on our findings, we propose the following quenching scenario:
-
high-mass galaxies: rapid, transformative quenching, mostly mass-driven;
-
intermediate-mass galaxies: mild quenching, partially environment-driven;
-
low-mass galaxies: mostly star-forming, environmental quenching is slow and inefficient.
Our results align with Peng et al. (2012) regarding mass quenching in high-mass galaxies and environmental effects on intermediate-mass satellites. However, for low-mass galaxies, we find evidence for slow quenching, whereas Peng et al. (2012) and recent local studies report higher quenching efficiencies. Specifically, Ann et al. (2025) show that in the local Universe (z < 0.01), dwarf galaxies in group and cluster environments undergo early quenching, while late quenching is prevalent in the field. This discrepancy may indicate that the environmental processes that influence local samples differ from those that operate at higher redshifts. High-mass galaxies experience rapid, transformative quenching, in agreement with findings from the GOGREEN clusters (McNab et al. 2021; Gully et al. 2025). Intermediate-mass galaxies exhibit mild, environment-driven quenching, consistent with a small excess of transition galaxies in clusters, while low-mass galaxies remain largely star-forming, indicating slower, less efficient environmental quenching than reported in GOGREEN. This may be due to GOGREEN probing cluster environments instead of groups. The observed evolutionary trend is consistent with the higher quenching probabilities in dense environments reported by Taylor et al. (2023). De Daniloff et al. (2025) report that in the Cl0024 cluster at z ∼ 0.4, ∼35% of the star forming galaxies are in a “suppressed” state, while field galaxies are mostly active. In contrast, our COSMOS-Web groups at z ∼ 0.5 show a strong stellar-mass dependence: ∼80% of massive galaxies (M★ > 1010.5 M⊙) are quiescent, ∼20% at intermediate masses, and < 10% at low masses (log(Mcut(z)) < log10(M★/M⊙) < 9.5). Unlike Cl0024, our classification includes both morphologically identified ETGs and LTGs, capturing fully quenched and suppressed populations, highlighting a faster quenching of massive satellites and ongoing star formation in low-mass systems.
In a recent study by Euclid Collaboration: Gentile et al. (2026), the relationship between local density and quenching or morphological transformation was investigated up to z ≈ 1 over an area exceeding 60 deg2. The study found consistent results, namely that quenching precedes morphological transformation in dense environments. Furthermore, Hatamnia et al. (2025) studied the evolution of galaxies in LSS in the COSMOS-Web field up to z ∼ 7 and found that stellar mass positively correlates with density up to z ∼ 5.5, with mass-driven quenching dominant at z ≳ 2.5 and environmental quenching becoming increasingly effective for low-mass galaxies toward lower redshift. Quenching follows two fundamentally different pathways, closely tied to stellar mass. In massive galaxies, we suggest that the rapid cessation of star formation occurs early and violently, transforming disks into spheroidal ETGs. This process may be partially driven by AGN feedback, along with other mechanisms such as violent disk instabilities or major mergers (see Sect. 3.3 for a detailed analysis of the AGN fraction). At intermediate masses, quenching appears to proceed more slowly and is dominated by environmental processes, such as gas starvation or stripping, which suppress star formation while largely preserving disk structures, leaving behind passive LTGs. At the low-mass end, quenching remains highly inefficient: even when external mechanisms act, galaxies generally retain their disk morphology. Thus, we suggest that while massive galaxies follow a fast, transformative quenching route, lower-mass systems experience a slower, non-destructive pathway, illustrating the dual nature of galaxy evolution across cosmic time.
It is instructive to compare the quenching efficiencies in Fig. 8b with the mass-dependent fractions in Fig. 9. While ETGs are intrinsically more likely to be quenched than LTGs across all redshifts (Fig. 8b), Fig. 9 reveals a strong mass dependence in the population of quiescent galaxies (Q). Specifically, in the low- and intermediate-mass bins (log(M★/M⊙) < 10.5), LTGs represent a higher fraction of the quiescent population compared to ETGs. This confirms that the composition of the RS is governed by both quenching efficiency and the underlying mass-dependent population mix: even though LTGs have a lower individual quenching probability, their significantly higher abundance at lower masses ensures they remain the dominant morphological type among quenched galaxies in those regimes.
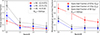 |
Fig. 8. Mean fractions of galaxies located above RS −0.25 mag as a function of redshift. Left: The black line represents the total fraction, while the red (ETG) and blue (LTG) lines show their additive contributions to the total cluster population (f = Ntype/NTotal). Right: The lines show the type-wise quenching efficiency. In this panel, the ETG and LTG fractions are normalized by their own respective sub-population totals (f = Ntype/NTotal, type) to illustrate the intrinsic probability of each morphology being located above RS −0.25. |
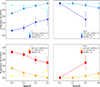 |
Fig. 9. Evolution of LTG (top row) and ETG (bottom row) fractions within the quiescent (Q), main-sequence+starburst (MS+SB) regimes (from left to right). Marker size encodes stellar-mass bins: [log(M★/M⊙) < 9.5], [9.5 ≤ log(M★/M⊙)≤10.5], and [log(M★/M⊙) > 10.5], and dashed error bars represent binomial uncertainties. We apply a stellar-mass threshold of log(Mcut(z)) to define the final sample, ranges from 6.5 at z = 0 to 8.9 at z = 4.0. |
4. Summary and Conclusion
Using the COSMOS-Web JWST data set we derived a motivated radius Rcut for each group by intersecting radial surface-density profiles with the local field background. We find that denser systems occupy larger radii than filamentary or field structures (see Sect. 3.3.4) and that LTGs outnumber ETGs by roughly 2:1 within 100 kpc. The wide COD range (4–70 counts arcmin−2) indicates that many cores are still assembling or retain significant substructure.
Fifteen HLAGN are matched to the 25 richest groups, with four sources lying in the central 0.2 Mpc (72–131 kpc) and eleven inhabiting the outskirts (177–834 kpc); their fractional contribution peaks at z ∼ 2 for both groups and field galaxies, tracing the availability of cold gas at cosmic noon and indicating that interactions in group outskirts increasingly sustain black-hole growth at high redshift.
Central HLAGN hosts span starburst, main-sequence, and quiescent classes (1/2/2 respectively), demonstrating that residual gas reservoirs can continue feeding black holes after star formation quenches; individual cases such as the starburst AGN in Group 7 (z = 1.56) and in Group 304 (z = 0.34) illustrate how nuclear activity and intense star formation coexist across environments (Sect. 3.3.3).
We identified red sequences (RS) in five out of 25 galaxy groups, prominently established at z < 1, with early emergence in the RS locus up to z ∼ 2.2. The composition of the red sequence reveals an important result: across the entire sample, it contains ∼10% ETGs and ∼13% LTGs of the total galaxy population. This significant presence of LTGs on the red sequence implies low star-formation in disk-like galaxies, hence that environmental quenching occurs in disks before the morphological transformation to spheroidals and ellipticals. This is consistent with satellite-specific mechanisms such as ram-pressure stripping, strangulation, and tidal heating acting alongside centrally triggered feedback (Sect. 3.4).
Stacked M★–SFR diagnostics reveal complementary quenching pathways: starburst and main-sequence populations remain LTG-dominated across all masses, while quiescent fractions become increasingly ETG-dominated with stellar mass, pointing to rapid, mass-driven shutdown in the most massive galaxies and slower (perhaps environment-regulated) fading in lower-mass disks. Moreover, while ETGs possess higher intrinsic quenching efficiencies across the entire redshift range, the quiescent population is numerically dominated by LTGs at lower masses. This indicates that the composition of the red sequence is mass-dependent, reflecting a competition between ETG efficiency and the higher overall abundance of LTGs (Sects. 3.4, 3.6). A natural next step is a complementary wide-field study that marries COSMOS-Web with the forthcoming Euclid survey, using Euclid’s vast area and spectroscopy to extend these group diagnostics to lower-density environments, validate Rcut trends across the cosmic web, and test whether the AGN and quenching patterns identified here persist on the largest accessible scales.
Data availability
Some example plots of RSD, CMDs, and SFR–Mass are shown in the Appendix, while the full set of sample plots is available at Zenodo link9.
Acknowledgments
LM acknowledges the financial contribution from the PRIN-MUR 2022 20227RNLY3 grant “The concordance cosmological model: stress-tests with galaxy clusters” supported by Next Generation EU and from the grant ASI n. 2024-10-HH.0 “Attività scientifiche per la missione Euclid – fase E.
References
- Alberts, S., & Noble, A. 2022, Universe, 8, 554 [Google Scholar]
- Aldás, F., Gómez, F. A., Vega-Martínez, C., Zenteno, A., & Carrasco, E. R. 2025, A&A, 699, A313 [NASA ADS] [CrossRef] [EDP Sciences] [Google Scholar]
- Ann, H. B., Seo, M., & Jeon, M. 2025, MNRAS, 542, 3049 [Google Scholar]
- Arango-Toro, R. C., Ilbert, O., Ciesla, L., et al. 2025, A&A, 696, A159 [NASA ADS] [CrossRef] [EDP Sciences] [Google Scholar]
- Asplund, M., Grevesse, N., Sauval, A. J., & Scott, P. 2009, ARA&A, 47, 481 [NASA ADS] [CrossRef] [Google Scholar]
- Baldry, I. K., Balogh, M. L., Bower, R. G., et al. 2006, MNRAS, 373, 469 [Google Scholar]
- Balogh, M. L., McGee, S. L., Mok, A., et al. 2014, MNRAS, 443, 2679 [NASA ADS] [CrossRef] [Google Scholar]
- Balogh, M. L., McGee, S. L., Mok, A., et al. 2016, MNRAS, 456, 4364 [NASA ADS] [CrossRef] [Google Scholar]
- Bamford, S. P., Nichol, R. C., Baldry, I. K., et al. 2009, MNRAS, 393, 1324 [NASA ADS] [CrossRef] [Google Scholar]
- Baxter, D. C., Cooper, M. C., Balogh, M. L., et al. 2023, MNRAS, 526, 3716 [NASA ADS] [CrossRef] [Google Scholar]
- Behroozi, P. S., Wechsler, R. H., & Conroy, C. 2013, ApJ, 770, 57 [NASA ADS] [CrossRef] [Google Scholar]
- Bellagamba, F., Roncarelli, M., Maturi, M., & Moscardini, L. 2018, MNRAS, 473, 5221 [NASA ADS] [CrossRef] [Google Scholar]
- Berta, S., Lutz, D., Santini, P., et al. 2013, A&A, 551, A100 [NASA ADS] [CrossRef] [EDP Sciences] [Google Scholar]
- Best, P. N., Kauffmann, G., Heckman, T. M., et al. 2005, MNRAS, 362, 25 [Google Scholar]
- Best, P. N., von der Linden, A., Kauffmann, G., Heckman, T. M., & Kaiser, C. R. 2007, MNRAS, 379, 894 [Google Scholar]
- Bianconi, M., Smith, G. P., Haines, C. P., et al. 2018, MNRAS, 473, L79 [CrossRef] [Google Scholar]
- Boquien, M., Burgarella, D., Roehlly, Y., et al. 2019, A&A, 622, A103 [NASA ADS] [CrossRef] [EDP Sciences] [Google Scholar]
- Boselli, A., & Gavazzi, G. 2006, PASP, 118, 517 [Google Scholar]
- Boselli, A., Fossati, M., & Sun, M. 2022, A&ARv, 30, 3 [NASA ADS] [CrossRef] [Google Scholar]
- Bouwens, R. J., Aravena, M., Decarli, R., et al. 2016, ApJ, 833, 72 [NASA ADS] [CrossRef] [Google Scholar]
- Bruzual, G., & Charlot, S. 2003, MNRAS, 344, 1000 [NASA ADS] [CrossRef] [Google Scholar]
- Calzetti, D., Armus, L., Bohlin, R. C., et al. 2000, ApJ, 533, 682 [NASA ADS] [CrossRef] [Google Scholar]
- Capak, P., Aussel, H., Ajiki, M., et al. 2007, ApJS, 172, 99 [Google Scholar]
- Caputi, K. I., Lilly, S. J., Aussel, H., et al. 2008, ApJ, 680, 939 [Google Scholar]
- Carnall, A. C., McLure, R. J., Dunlop, J. S., et al. 2019, MNRAS, 490, 417 [Google Scholar]
- Casey, C. M., Cooray, A., Capak, P., et al. 2015, ApJ, 808, L33 [NASA ADS] [CrossRef] [Google Scholar]
- Casey, C. M., Kartaltepe, J. S., Drakos, N. E., et al. 2023, ApJ, 954, 31 [NASA ADS] [CrossRef] [Google Scholar]
- Castignani, G., Vulcani, B., Finn, R. A., et al. 2022, ApJS, 259, 43 [NASA ADS] [CrossRef] [Google Scholar]
- Cautun, M., van de Weygaert, R., Jones, B. J. T., & Frenk, C. S. 2014, MNRAS, 441, 2923 [Google Scholar]
- Cavagnolo, K. W., McNamara, B. R., Nulsen, P. E. J., et al. 2010, ApJ, 720, 1066 [Google Scholar]
- Cerulo, P., Couch, W. J., Lidman, C., et al. 2017, MNRAS, 472, 254 [NASA ADS] [CrossRef] [Google Scholar]
- Chartab, N., Mobasher, B., Darvish, B., et al. 2020, ApJ, 890, 7 [NASA ADS] [CrossRef] [Google Scholar]
- Cooke, E. A., Hatch, N. A., Stern, D., et al. 2016, ApJ, 816, 83 [NASA ADS] [CrossRef] [Google Scholar]
- Cortese, L., Catinella, B., & Smith, R. 2021, PASA, 38, e035 [NASA ADS] [CrossRef] [Google Scholar]
- Crossett, J. P., Pimbblet, K. A., Stott, J. P., & Jones, D. H. 2013, MNRAS, 437, 2521 [Google Scholar]
- Cucciati, O., Iovino, A., Marinoni, C., et al. 2006, A&A, 458, 39 [NASA ADS] [CrossRef] [EDP Sciences] [Google Scholar]
- Cucciati, O., Zamorani, G., Lemaux, B. C., et al. 2014, A&A, 570, A16 [NASA ADS] [CrossRef] [EDP Sciences] [Google Scholar]
- Cui, J., Gu, Q., & Shi, Y. 2024, MNRAS, 528, 2391 [Google Scholar]
- Cullen, F., Cirasuolo, M., McLure, R. J., Dunlop, J. S., & Bowler, R. A. A. 2014, MNRAS, 440, 2300 [NASA ADS] [CrossRef] [Google Scholar]
- Cullen, F., McLure, R. J., Dunlop, J. S., et al. 2019, MNRAS, 487, 2038 [Google Scholar]
- Curti, M., Maiolino, R., Curtis-Lake, E., et al. 2024, A&A, 684, A75 [NASA ADS] [CrossRef] [EDP Sciences] [Google Scholar]
- Cybulski, R., Yun, M. S., Fazio, G. G., & Gutermuth, R. A. 2014, MNRAS, 439, 3564 [NASA ADS] [CrossRef] [Google Scholar]
- da Cunha, E., Charlot, S., & Elbaz, D. 2008, MNRAS, 388, 1595 [Google Scholar]
- Dale, D. A., Helou, G., Magdis, G. E., et al. 2014, ApJ, 784, 83 [Google Scholar]
- Darragh Ford, E., Laigle, C., Gozaliasl, G., et al. 2019, MNRAS, 489, 5695 [Google Scholar]
- De Daniloff, S. B., Bongiovanni, Á., Sánchez-Portal, M., et al. 2025, A&A, 702, A187 [NASA ADS] [CrossRef] [EDP Sciences] [Google Scholar]
- Dekel, A., Birnboim, Y., Engel, G., et al. 2009, Nature, 457, 451 [Google Scholar]
- Delvecchio, I., Smolčić, V., Zamorani, G., et al. 2017, A&A, 602, A3 [NASA ADS] [CrossRef] [EDP Sciences] [Google Scholar]
- Diener, C., Lilly, S. J., Ledoux, C., et al. 2015, ApJ, 802, 31 [NASA ADS] [CrossRef] [Google Scholar]
- Ding, X., Silverman, J., Treu, T., et al. 2020, ApJ, 888, 37 [NASA ADS] [CrossRef] [Google Scholar]
- Dong, R., Rasmussen, J., & Mulchaey, J. S. 2010, ApJ, 712, 883 [NASA ADS] [CrossRef] [Google Scholar]
- Dressler, A. 1980, ApJ, 236, 351 [Google Scholar]
- Dunn, R. J. H., & Fabian, A. C. 2006, MNRAS, 373, 959 [Google Scholar]
- Eckert, D., Gaspari, M., Gastaldello, F., Le Brun, A. M. C., & O’Sullivan, E. 2021, Universe, 7, 142 [NASA ADS] [CrossRef] [Google Scholar]
- Elbaz, D., Daddi, E., Le Borgne, D., et al. 2007, A&A, 468, 33 [NASA ADS] [CrossRef] [EDP Sciences] [Google Scholar]
- Euclid Collaboration (Gentile, F., et al.) 2026, A&A, in press, https://doi.org/10.1051/0004-6361/202557633 [Google Scholar]
- Fabian, A. C. 2012, ARA&A, 50, 455 [Google Scholar]
- Falder, J. T., Stevens, J. A., Jarvis, M. J., et al. 2010, MNRAS, 405, 347 [NASA ADS] [Google Scholar]
- Feltre, A., Hatziminaoglou, E., Fritz, J., & Franceschini, A. 2012, MNRAS, 426, 120 [Google Scholar]
- Finn, R. A., Vulcani, B., Rudnick, G., et al. 2023, MNRAS, 521, 4614 [CrossRef] [Google Scholar]
- Finoguenov, A., Guzzo, L., Hasinger, G., et al. 2007, ApJS, 172, 182 [Google Scholar]
- Foltz, R., Wilson, G., Muzzin, A., et al. 2018, ApJ, 866, 136 [NASA ADS] [CrossRef] [Google Scholar]
- Fossati, M. 2017, Galaxy Evolution Across Time, 69 [Google Scholar]
- Franco, M., Casey, C. M., Koekemoer, A. M., et al. 2025, ApJ, submitted [arXiv:2506.03256] [Google Scholar]
- Fudamoto, Y., Oesch, P. A., Schouws, S., et al. 2021, Nature, 597, 489 [CrossRef] [Google Scholar]
- Gallazzi, A., Charlot, S., Brinchmann, J., White, S. D. M., & Tremonti, C. A. 2005, MNRAS, 362, 41 [Google Scholar]
- Gaspari, M., Temi, P., & Brighenti, F. 2016, MNRAS, 466, 677 [Google Scholar]
- Gaspari, M., Tombesi, F., & Cappi, M. 2020, Nat. Astron., 4, 10 [Google Scholar]
- Gavazzi, G., Fumagalli, M., Cucciati, O., & Boselli, A. 2010, A&A, 517, A73 [NASA ADS] [CrossRef] [EDP Sciences] [Google Scholar]
- Ghaffari, Z., Westhues, C., Haas, M., et al. 2017, AN, 338, 823 [Google Scholar]
- Ghaffari, Z., Haas, M., Chiaberge, M., et al. 2021, A&A, 653, A44 [NASA ADS] [CrossRef] [EDP Sciences] [Google Scholar]
- Giodini, S., Pierini, D., Finoguenov, A., et al. 2009, ApJ, 703, 982 [NASA ADS] [CrossRef] [Google Scholar]
- Gitti, M., Brighenti, F., & McNamara, B. R. 2012, Adv. Astron., 2012, 950641 [CrossRef] [Google Scholar]
- Gladders, M. D., & Yee, H. K. C. 2000, AJ, 120, 2148 [NASA ADS] [CrossRef] [Google Scholar]
- Gozaliasl, G., Khosroshahi, H. G., Dariush, A. A., et al. 2014a, A&A, 571, A49 [NASA ADS] [CrossRef] [EDP Sciences] [Google Scholar]
- Gozaliasl, G., Finoguenov, A., Khosroshahi, H. G., et al. 2014b, A&A, 566, A140 [NASA ADS] [CrossRef] [EDP Sciences] [Google Scholar]
- Gozaliasl, G., Finoguenov, A., Khosroshahi, H. G., et al. 2016, MNRAS, 458, 2762 [NASA ADS] [CrossRef] [Google Scholar]
- Gozaliasl, G., Finoguenov, A., Khosroshahi, H. G., et al. 2018, MNRAS, 475, 2787 [CrossRef] [Google Scholar]
- Gozaliasl, G., Finoguenov, A., Tanaka, M., et al. 2019, MNRAS, 483, 3545 [Google Scholar]
- Gozaliasl, G., Finoguenov, A., Khosroshahi, H. G., et al. 2020, A&A, 635, A36 [EDP Sciences] [Google Scholar]
- Gozaliasl, G., Finoguenov, A., Babul, A., et al. 2024, A&A, 690, A315 [NASA ADS] [CrossRef] [EDP Sciences] [Google Scholar]
- Gozaliasl, G., Yang, L., Kartaltepe, J. S., et al. 2025, A&A, 703, A129 [NASA ADS] [CrossRef] [EDP Sciences] [Google Scholar]
- Grandis, S., Ghirardini, V., Bocquet, S., et al. 2024, A&A, 687, A178 [NASA ADS] [CrossRef] [EDP Sciences] [Google Scholar]
- Grützbauch, R., Conselice, C. J., Varela, J., et al. 2011, MNRAS, 411, 929 [Google Scholar]
- Grützbauch, R., Bauer, A. E., Jørgensen, I., & Varela, J. 2012, MNRAS, 423, 3652 [Google Scholar]
- Gully, H., Hatch, N., Ahad, S. L., et al. 2025, MNRAS, 539, 3058 [Google Scholar]
- Gunn, J. E., & Gott, J. R., III. 1972, ApJ, 176, 1 [NASA ADS] [CrossRef] [Google Scholar]
- Harish, S., Kartaltepe, J. S., Liu, D., et al. 2025, ApJ, 992, 45 [Google Scholar]
- Harrison, C. M. 2017, Nat. Astron., 1, 0165 [NASA ADS] [CrossRef] [Google Scholar]
- Hasinger, G., Capak, P., Salvato, M., et al. 2018, ApJ, 858, 77 [Google Scholar]
- Hatamnia, H., Mobasher, B., Taamoli, S., et al. 2025, ApJ, submitted [arXiv:2511.10727] [Google Scholar]
- Heckman, T. M., & Best, P. N. 2014, ARA&A, 52, 589 [Google Scholar]
- Hung, C.-L., Casey, C. M., Chiang, Y.-K., et al. 2016, ApJ, 826, 130 [NASA ADS] [CrossRef] [Google Scholar]
- Ilbert, O., Arnouts, S., McCracken, H. J., et al. 2006, A&A, 457, 841 [NASA ADS] [CrossRef] [EDP Sciences] [Google Scholar]
- Ilbert, O., Capak, P., Salvato, M., et al. 2009, ApJ, 690, 1236 [NASA ADS] [CrossRef] [Google Scholar]
- Ilbert, O., McCracken, H. J., Le Fèvre, O., et al. 2013, A&A, 556, A55 [NASA ADS] [CrossRef] [EDP Sciences] [Google Scholar]
- Jaffé, Y. L., Smith, R., Candlish, G. N., et al. 2015, MNRAS, 448, 1715 [Google Scholar]
- Janowiecki, S., Catinella, B., Cortese, L., Saintonge, A., & Wang, J. 2020, MNRAS, 493, 1982 [Google Scholar]
- Kauffmann, G., White, S. D. M., Heckman, T. M., et al. 2004, MNRAS, 353, 713 [Google Scholar]
- Kawinwanichakij, L., Papovich, C., Quadri, R. F., et al. 2017, ApJ, 847, 134 [NASA ADS] [CrossRef] [Google Scholar]
- Khostovan, A. A., Kartaltepe, J. S., Salvato, M., et al. 2026, ApJS, 282, 6 [Google Scholar]
- Kocevski, D. D., Lubin, L. M., Gal, R., et al. 2009, ApJ, 690, 295 [NASA ADS] [CrossRef] [Google Scholar]
- Koekemoer, A. M., Aussel, H., Calzetti, D., et al. 2007, ApJS, 172, 196 [Google Scholar]
- Kolokythas, K., O’Sullivan, E., Intema, H., et al. 2019, MNRAS, 489, 2488 [CrossRef] [Google Scholar]
- Kotyla, J. P., Chiaberge, M., Baum, S., et al. 2016, ApJ, 826, 46 [NASA ADS] [CrossRef] [Google Scholar]
- Laigle, C., McCracken, H. J., Ilbert, O., et al. 2016, ApJS, 224, 24 [Google Scholar]
- Larson, R. B., Tinsley, B. M., & Caldwell, C. N. 1980, ApJ, 237, 692 [Google Scholar]
- Lee-Brown, D. B., Rudnick, G. H., Momcheva, I. G., et al. 2017, ApJ, 844, 43 [Google Scholar]
- Lemaux, B. C., Cucciati, O., Tasca, L. A. M., et al. 2014, A&A, 572, A41 [NASA ADS] [CrossRef] [EDP Sciences] [Google Scholar]
- Li, M., Cai, Z., Bian, F., et al. 2023, ApJ, 955, L18 [CrossRef] [Google Scholar]
- Lilly, S. J., Le Fèvre, O., Renzini, A., et al. 2007, ApJS, 172, 70 [Google Scholar]
- Lin, Y.-T., & Mohr, J. J. 2007, ApJS, 170, 71 [Google Scholar]
- Liu, D., Daddi, E., Dickinson, M., et al. 2018, ApJ, 853, 172 [Google Scholar]
- Magliocchetti, M., Popesso, P., Brusa, M., & Salvato, M. 2018, MNRAS, 478, 3848 [Google Scholar]
- Mahajan, S., Haines, C. P., & Raychaudhury, S. 2010, MNRAS, 404, 1745 [NASA ADS] [Google Scholar]
- Maiolino, R., Nagao, T., Grazian, A., et al. 2008, A&A, 488, 463 [NASA ADS] [CrossRef] [EDP Sciences] [Google Scholar]
- Mannucci, F., Cresci, G., Maiolino, R., Marconi, A., & Gnerucci, A. 2010, MNRAS, 408, 2115 [NASA ADS] [CrossRef] [Google Scholar]
- Maturi, M., Bellagamba, F., Radovich, M., et al. 2019, MNRAS, 485, 498 [Google Scholar]
- McCracken, H. J., Milvang-Jensen, B., Dunlop, J., et al. 2012, A&A, 544, A156 [NASA ADS] [CrossRef] [EDP Sciences] [Google Scholar]
- McDermid, R. M., Alatalo, K., Blitz, L., et al. 2015, MNRAS, 448, 3484 [Google Scholar]
- McNab, K., Balogh, M. L., van der Burg, R. F. J., et al. 2021, MNRAS, 508, 157 [CrossRef] [Google Scholar]
- McNamara, B. R., & Nulsen, P. E. J. 2007, ARA&A, 45, 117 [NASA ADS] [CrossRef] [Google Scholar]
- Mei, S., Hatch, N. A., Amodeo, S., et al. 2023, A&A, 670, A58 [NASA ADS] [CrossRef] [EDP Sciences] [Google Scholar]
- Moore, B., Katz, N., Lake, G., Dressler, A., & Oemler, A. 1996, Nature, 379, 613 [Google Scholar]
- Muzzin, A., Marchesini, D., Stefanon, M., et al. 2013, ApJ, 777, 18 [NASA ADS] [CrossRef] [Google Scholar]
- Nakajima, K., Ouchi, M., Isobe, Y., et al. 2023, ApJS, 269, 33 [NASA ADS] [CrossRef] [Google Scholar]
- Nantais, J. B., Muzzin, A., van der Burg, R. F. J., et al. 2017, MNRAS, 465, L104 [Google Scholar]
- Navarro, J. F., Frenk, C. S., & White, S. D. M. 1997, ApJ, 490, 493 [Google Scholar]
- Newman, A. B., Ellis, R. S., Andreon, S., et al. 2014, ApJ, 788, 51 [NASA ADS] [CrossRef] [Google Scholar]
- Oemler, A., Jr. 1974, ApJ, 194, 1 [NASA ADS] [CrossRef] [Google Scholar]
- Olave-Rojas, D., Cerulo, P., Demarco, R., et al. 2018, MNRAS, 479, 2328 [Google Scholar]
- O’Sullivan, E., Ponman, T. J., Kolokythas, K., et al. 2017, MNRAS, 472, 1482 [CrossRef] [Google Scholar]
- Papovich, C., Kawinwanichakij, L., Quadri, R. F., et al. 2018, ApJ, 854, 30 [NASA ADS] [CrossRef] [Google Scholar]
- Pasquali, A., Gallazzi, A., & van den Bosch, F. C. 2012, MNRAS, 425, 273 [NASA ADS] [CrossRef] [Google Scholar]
- Patel, S. G., Holden, B. P., Kelson, D. D., Illingworth, G. D., & Franx, M. 2009, ApJ, 705, L67 [Google Scholar]
- Peng, Y.-J., Lilly, S. J., Kovač, K., et al. 2010, ApJ, 721, 193 [Google Scholar]
- Peng, Y.-J., Lilly, S. J., Renzini, A., & Carollo, M. 2012, ApJ, 757, 4 [NASA ADS] [CrossRef] [Google Scholar]
- Peng, Y., Maiolino, R., & Cochrane, R. 2015, Nature, 521, 192 [Google Scholar]
- Pintos-Castro, I., Yee, H. K. C., Muzzin, A., Old, L., & Wilson, G. 2019, ApJ, 876, 40 [Google Scholar]
- Poggianti, B. M., Smail, I., Dressler, A., et al. 1999, ApJ, 518, 576 [Google Scholar]
- Popesso, P., Rodighiero, G., Saintonge, A., et al. 2011, A&A, 532, A145 [NASA ADS] [CrossRef] [EDP Sciences] [Google Scholar]
- Popesso, P., Concas, A., Cresci, G., et al. 2023, MNRAS, 519, 1526 [Google Scholar]
- Postman, M., & Geller, M. J. 1984, ApJ, 281, 95 [Google Scholar]
- Pozzetti, L., Bolzonella, M., Zucca, E., et al. 2010, A&A, 523, A13 [NASA ADS] [CrossRef] [EDP Sciences] [Google Scholar]
- Quadri, R. F., Williams, R. J., Franx, M., & Hildebrandt, H. 2012, ApJ, 744, 88 [NASA ADS] [CrossRef] [Google Scholar]
- Reeves, A. M. M., Balogh, M. L., van der Burg, R. F. J., et al. 2021, MNRAS, 506, 3364 [NASA ADS] [CrossRef] [Google Scholar]
- Rodriguez-Gomez, V., Pillepich, A., Sales, L. V., et al. 2016, MNRAS, 458, 2371 [Google Scholar]
- Sabater, J., Best, P. N., Hardcastle, M. J., et al. 2019, A&A, 622, A17 [NASA ADS] [CrossRef] [EDP Sciences] [Google Scholar]
- Sanders, R. L., Shapley, A. E., Kriek, M., et al. 2015, ApJ, 799, 138 [NASA ADS] [CrossRef] [Google Scholar]
- Sanders, R. L., Shapley, A. E., Jones, T., et al. 2021, ApJ, 914, 19 [CrossRef] [Google Scholar]
- Santos, J. S., Altieri, B., Popesso, P., et al. 2013, MNRAS, 433, 1287 [Google Scholar]
- Sarron, F., & Conselice, C. J. 2021, MNRAS, 506, 2136 [NASA ADS] [CrossRef] [Google Scholar]
- Sazonova, E., Alatalo, K., Lotz, J., et al. 2020, ApJ, 899, 85 [Google Scholar]
- Scoville, N., Aussel, H., Brusa, M., et al. 2007, ApJS, 172, 1 [Google Scholar]
- Sersic, J. L. 1968, Atlas de Galaxias Australes (Cordoba, Argentina: Observatorio Astronómico) [Google Scholar]
- Shimakawa, R., Tanaka, T. S., Toshikage, S., & Tanaka, M. 2021, PASJ, 73, 1575 [NASA ADS] [CrossRef] [Google Scholar]
- Shin, J., Woo, J.-H., & Mulchaey, J. S. 2016, ApJS, 227, 31 [NASA ADS] [CrossRef] [Google Scholar]
- Shuntov, M., Akins, H. B., Paquereau, L., et al. 2025, A&A, 704, A339 [NASA ADS] [CrossRef] [EDP Sciences] [Google Scholar]
- Sijacki, D., Springel, V., Di Matteo, T., & Hernquist, L. 2007, MNRAS, 380, 877 [NASA ADS] [CrossRef] [Google Scholar]
- Smolčić, V., Schinnerer, E., Finoguenov, A., et al. 2007, ApJS, 172, 295 [CrossRef] [Google Scholar]
- Smolčić, V., Finoguenov, A., Zamorani, G., et al. 2011, MNRAS, 416, L31 [Google Scholar]
- Speagle, J. S., Steinhardt, C. L., Capak, P. L., & Silverman, J. D. 2014, ApJS, 214, 15 [Google Scholar]
- Springel, V. 2005, MNRAS, 364, 1105 [Google Scholar]
- Stalder, B., Ruel, J., Šuhada, R., et al. 2013, ApJ, 763, 93 [NASA ADS] [CrossRef] [Google Scholar]
- Stanton, T. M., Cullen, F., Carnall, A. C., et al. 2025, MNRAS, submitted [arXiv:2511.00705] [Google Scholar]
- Strazzullo, V., Gobat, R., Daddi, E., et al. 2013, ApJ, 772, 118 [NASA ADS] [CrossRef] [Google Scholar]
- Strazzullo, V., Pannella, M., Mohr, J. J., et al. 2019, A&A, 622, A117 [NASA ADS] [CrossRef] [EDP Sciences] [Google Scholar]
- Taamoli, S., Nezhad, N., Mobasher, B., et al. 2024, ApJ, 977, 263 [Google Scholar]
- Taniguchi, Y., Scoville, N., Murayama, T., et al. 2007, ApJS, 172, 9 [Google Scholar]
- Taylor, E., Almaini, O., Merrifield, M., et al. 2023, MNRAS, 522, 2297 [NASA ADS] [CrossRef] [Google Scholar]
- Thomas, D., Maraston, C., Schawinski, K., Sarzi, M., & Silk, J. 2010, MNRAS, 404, 1775 [NASA ADS] [Google Scholar]
- Toni, G., Maturi, M., Finoguenov, A., Moscardini, L., & Castignani, G. 2024, A&A, 687, A56 [NASA ADS] [CrossRef] [EDP Sciences] [Google Scholar]
- Toni, G., Gozaliasl, G., Maturi, M., et al. 2025, A&A, 697, A197 [NASA ADS] [CrossRef] [EDP Sciences] [Google Scholar]
- Toni, G., Maturi, M., Castignani, G., et al. 2026, A&A, 707, A87 [NASA ADS] [CrossRef] [EDP Sciences] [Google Scholar]
- Tremonti, C. A., Heckman, T. M., Kauffmann, G., et al. 2004, ApJ, 613, 898 [Google Scholar]
- van der Burg, R. F. J., McGee, S., Aussel, H., et al. 2018, A&A, 618, A140 [NASA ADS] [CrossRef] [EDP Sciences] [Google Scholar]
- van der Wel, A., Franx, M., van Dokkum, P. G., et al. 2014, ApJ, 788, 28 [Google Scholar]
- Vardoulaki, E., Gozaliasl, G., Finoguenov, A., Novak, M., & Khosroshahi, H. G. 2024, VizieR On-line Data Catalog: J/A+A/693/A61 [Google Scholar]
- Werner, S. V., Hatch, N. A., Muzzin, A., et al. 2022, MNRAS, 510, 674 [Google Scholar]
- Wetzel, A. R., Tinker, J. L., & Conroy, C. 2012, MNRAS, 424, 232 [NASA ADS] [CrossRef] [Google Scholar]
- Wetzel, A. R., Tinker, J. L., Conroy, C., & van den Bosch, F. C. 2013, MNRAS, 432, 336 [Google Scholar]
- Whitaker, K. E., Pope, A., Cybulski, R., et al. 2017, ApJ, 850, 208 [NASA ADS] [CrossRef] [Google Scholar]
- Whitmore, B. C., Gilmore, D. M., & Jones, C. 1993, ApJ, 407, 489 [NASA ADS] [CrossRef] [Google Scholar]
- Wylezalek, D., Galametz, A., Stern, D., et al. 2013, ApJ, 769, 79 [NASA ADS] [CrossRef] [Google Scholar]
- Yang, L., Kartaltepe, J. S., Franco, M., et al. 2025, ApJS, 281, 68 [Google Scholar]
- Zabelle, B., Scarlata, C., Mehta, V., et al. 2023, ApJ, 947, 17 [Google Scholar]
- Ziparo, F., Popesso, P., Finoguenov, A., et al. 2014, MNRAS, 437, 458 [Google Scholar]
flag = 3, 4 correspond to high-confidence galaxy redshifts, flag = 13, 14 to secure broad-line AGNs, and flag = 2, 12 to moderate-confidence measurements with ∼80% reliability.
V-shape means a secondary rise at larger projected radii, suggesting a nearby overdensity or companion structure.
Five times the selection window adopted for member galaxies, comparable to photometric-redshift uncertainties in wide surveys.
Appendix A: Richest groups in successive redshift bins
We present a table of contents for the richest group sample, extended with the latest available spectroscopic counterparts (Khostovan et al. 2026), and complemented by a large-scale structure (LSS) analysis performed by (Taamoli, in prep.).
Richest groups in successive redshift bins.
Appendix B: Extended cumulative aperture results
Extended cumulative overdensity profiles at 400 and 600 kpc are shown in Fig. B.1, consistent with the 200 kpc trends: ETG densities decline while LTG densities slightly rise, highlighting persistent star-forming disks in group centers.
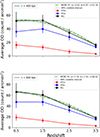 |
Fig. B.1. Average overdensity versus redshift for ETGs (red circles) and LTGs (blue squares), measured within cumulative apertures of 400 and 600 kpc. The MCMC fits and their 68% credible intervals are shown as dashed curves and shaded regions. These panels extend the results shown in Figure 4 for the 200 kpc aperture. |
Appendix C: Photometry completeness
We evaluate photometric completeness by fitting the bright-end number counts and measuring deviations as a function of magnitude, identifying the 100% level at the histogram peak. Table C.1 and Figure C.1 summarize the resulting limits for F814W, F277W, and F444W, and we adopt a conservative 95% completeness threshold for the remainder of the analysis.
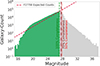 |
Fig. C.1. F277W completeness diagnostics showing galaxy counts as a function of total magnitude. Light-green and gray histograms trace the observed number counts, the dashed red line highlights the linear fit to the bright end, and vertical dashed markers mark the 100% (green), 70% (maroon), and 50% (red) completeness limits adopted in this work. |
Appendix D: Mass completeness
We calculate stellar mass completeness using the Pozzetti et al. (2010) method:
 (D.1)
(D.1)
This involves deriving a rescaled stellar mass (Mresc) for each galaxy by scaling its stellar mass to the survey’s limiting magnitude. After performing this rescaling for the entire sample, the limiting stellar mass (Mlim★) is defined as the 90th percentile of the resulting Mresc distribution. This process provides a reliable indicator of the mass down to which the galaxy sample is statistically complete. We have an excellent sample of galaxies at z ∼ 4, with complete samples down to log10M★ ∼ 8.5 M⊙ at the highest redshifts, and down to log10M★ ∼ 7 M⊙ in the nearby Universe, having a mass completeness improvement by about 1 dex compared to COSMOS2020 (Shuntov et al. 2025).
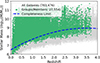 |
Fig. D.1. Stellar mass as a function of redshift for all catalog galaxies (gray) and confirmed group members (green). The dashed blue curve marks the stellar-mass completeness limit adopted in this analysis. |
Appendix E: Group radial surface density and annuli plots
We show a selection of radial density and annuli plots, similar to Fig. 2, in here. The remaining plots are available online via the Zenodo link10.
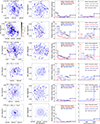 |
Fig. E.1. Annuli and radial surface-density diagnostics for group and field galaxy candidates; subsequent panels repeat the layout for additional groups. |
Photometric completeness limits for F814W, F277W, and F444W.
Appendix F: Customized red sequence model parameters
We summarize the key parameterizations used in our red sequence galaxy model. These include the redshift evolution and environmental metallicity boosts, the distribution of galaxy formation redshifts, dust attenuation, and the star formation history timescales. Each subsection contains the numerical prescriptions and scaling relations adopted in the model, allowing readers to trace how stellar mass, redshift, and environment influence the predicted properties of red sequence galaxies.
F.1. Redshift evolution and environmental metallicity boosts
The mass-metallicity relation (MZR) forms the foundation of our red sequence model. We extend the Sanders et al. (2021) MZR to include redshift evolution and environmental effects, while maintaining consistency with local observations (Tremonti et al. 2004; Gallazzi et al. 2005). The redshift evolution term Δz captures the systematic decrease of metallicity with increasing redshift, reflecting both high-redshift galaxy observations and theoretical expectations for chemical enrichment across cosmic time.
The redshift evolution parameters adopted are defined as follows:
-
z ≤ 1.0: Δz = −0.14z
-
1 < z: Δz = −0.14 − 0.20(z − 1.0)
-
z > 2.5: Δz = −0.44 − 0.35(z − 2.5)
The environmental metallicity boost accounts for the observation that galaxies in groups and clusters are more metal-rich than field galaxies at fixed stellar mass (Pasquali et al. 2012; Peng et al. 2015). This enhancement depends on stellar mass and decreases with redshift, reflecting the reduced efficiency of environmental processing in the early Universe (Fossati 2017; Chartab et al. 2020).
The environmental metallicity boost parameters adopted are defined as follows:
-
Baseline enhancement: 0.07 dex at low redshift
-
Mass-dependent term (in solar masses): 0.02 dex per dex above log10M★ = 10.5
-
Redshift suppression: decreases with z, roughly exp(−z/2)
-
High-redshift reduction: for z > 3, both terms are multiplied by 0.3
F.2. Formation redshift distribution
ZGHFormation redshift is the redshift at which a galaxy formed 50% of its stellar mass. Galaxy formation redshifts are assigned based on stellar mass and observation redshift following downsizing trends (Thomas et al. 2010; McDermid et al. 2015; Behroozi et al. 2013; Rodriguez-Gomez et al. 2016; Nakajima et al. 2023; Curti et al. 2024). The downsizing paradigm predicts that more massive galaxies form earlier and more rapidly than lower-mass systems. This approach ensures that our synthetic red sequence galaxies have realistic formation histories that match observed trends.
The assigned formation redshift is limited to zobs + 2 and capped at 10, with formation times shorter than 0.1 Gyr avoided to ensure physically realistic evolution. The mass-dependent formation redshifts reflect the observed correlation between galaxy mass and stellar age.
The formation redshift assignments by stellar mass adopted are defined as follows:
-
log10(M★/M⊙) ≥: zform = 4, 5, 6 for zobs = 1, 2, 3; up to min(8.0, zobs + 1.5)
-
10.5 ≤ log10(M★/M⊙) < 11.5: zform = 3, 4, 5 for zobs = 1, 2, 3; up to min(6.5, zobs + 1.0)
-
9.5 ≤ log10(M★/M⊙) < 10.5: zform = 2, 3 for zobs = 1, 2; up to min(4.5, zobs + 0.8)
-
log10(M★/M⊙) < 9.5: zform = 1.5, 2.5 for zobs = 1, 2; up to min(3.5, zobs + 0.5)
F.3. Dust attenuation for red sequence galaxies
Dust attenuation for red sequence galaxies is modeled as a function of stellar mass and redshift, following observational constraints (Whitaker et al. 2017; Bouwens et al. 2016; Fudamoto et al. 2021). More massive galaxies exhibit slightly higher V-0.25 attenuation, while attenuation increases moderately with redshift. To account for environmental effects, a small reduction is applied for galaxies in dense regions, reflecting processes such as gas stripping that can remove dust from group environments.
The resulting prescription ensures low but evolving dust levels, with an upper limit of AV = 0.3 mag, consistent with the typically quiescent nature of red sequence systems. This approach captures the observed trend that red sequence galaxies have lower dust content than star-forming systems while still accounting for the mass and redshift dependencies observed in quiescent populations. The dust attenuation parameters adopted are defined as follows:
-
Mass contribution: 0.08max(0, log M★ − 10.0)
-
Redshift contribution:
-
z < 1: 0.03z
-
1 ♤ z < 2.5: 0.03 + 0.05(z − 1)
-
z ≥ 2.5: 0.13 − 0.08(z − 2.5)
-
-
Environmental reduction: −0.04(1 + z)−0.5
F.4. Star formation history timescale (τ)
The age spread of red sequence galaxies is modeled through exponentially declining star formation histories characterized by a timescale τ, which depends on stellar mass and redshift (Thomas et al. 2010; McDermid et al. 2015). More massive galaxies are assigned shorter τ, reflecting their rapid, early formation, while lower-mass systems have more extended star formation histories. The timescale also evolves mildly with redshift, allowing slightly longer star formation at earlier epochs.
A minimum value of τ = 0.05 Gyr is imposed to ensure physically realistic evolution. This prescription captures the observed downsizing trend and provides realistic age spreads for synthetic red sequence galaxies, ensuring that our model produces galaxies with formation histories consistent with observed quiescent populations.
The star formation history timescale parameters adopted are defined as follows:
-
Base τ (Gyr) by stellar mass:
-
log M★ ≥ 11.5: τbase = 0.05
-
10.5 ≤ log M★ < 11.5: τbase = 0.15
-
9.5 ≤ log M★ < 10.5: τbase = 0.3
-
log M★ < 9.5: τbase = 0.6
-
-
Redshift scaling:
-
z < 1.0: τ = τbase(1 + 0.1z)
-
1.0 ≤ z < 2.5: τ = τbase(1.1 + 0.05(z − 1.0))
-
z ≥ 2.5: τ = τbase(1.15 − 0.1(z − 2.5))
-
Appendix G: SFR–Mass, CCD, and CMD plots
We show a selection of SFR–Mass, CCD, and CMD plots, similar to Fig. G.1, in here. The remaining plots are available online via the Zenodo link11.
All Tables
All Figures
|
Fig. 1. Intrinsic richness λ★ versus redshift (hexbin map) for the COSMOS-Web AMICO detections. Each bin is colored by the median SN_NO_CLUSTER, the dashed red line marks the richness threshold λ★ = 10.81, and the purple outlines highlight the 25 groups retained for detailed analysis. |
| In the text | |
|
Fig. 2. Member-selection diagnostics for group ID 4. Left: redshift distribution of AMICO candidates. The red solid line and hatched region (bounded by green lines) represent zDET and the adopted selection window Δz = ±0.01(1 + zDET), respectively. Middle: projected distribution of LTGs (blue) and ETGs (red) in concentric annuli, with galaxies having assoc_prob > 0.5 shown as filled circles and those with assoc_prob ≤ 0.5 as unfilled circles; matched HLAGN are marked as stars colored by |zAGN − zDET|. Right: radial surface density profile showing ETG, LTG, and combined overdensities after subtracting the local background (PER). Panels in the bottom row repeat the analysis for high field-probability galaxies (e.g., FIELD_PROB > 0.7). Negative values indicate underdensities, where the accumulated density minus the outskirts baseline becomes negative. |
| In the text | |
|
Fig. 3. Average radius Rcut as a function of redshift. Blue points show binned means with Poisson errors, and the dashed curve denotes the quadratic fit Rcut = −1.62z2 − 132.21z + 819.84 kpc. |
| In the text | |
|
Fig. 4. Average overdensity versus redshift for ETGs (red circles) and LTGs (blue squares), and their sum (black), measured within cumulative apertures of 200 kpc. Error bars denote the standard error of the mean, while the dashed curve and shaded regions show the MCMC fit and its 68% credible interval for the combined population. Average overdensity of field galaxies is consistent with a constant background level. |
| In the text | |
|
Fig. 5. Fraction of HLAGN as a function of redshift for central (r < 0.2 Mpc) and outskirt (0.2 < r < 1.0 Mpc) regions. Points show the combined group sample with Poisson uncertainties. |
| In the text | |
|
Fig. 6. Normalized average surface density for groups as a function of environment classification. Squares with error bars indicate the mean and uncertainty for cluster, filament, and field systems, normalized to the peak density of group ID 4. |
| In the text | |
|
Fig. 7. Diagnostic diagrams for group ID 4. Left: SFR versus stellar mass with LTGs (blue squares) and ETGs (red circles); the gray cross indicates typical uncertainties and the cyan dashed line shows the Popesso et al. (2023) main sequence. Middle: rest-frame color–color diagram. Crimson dashed line segments define an empirical, trapezoidal boundary separating the galaxy population into blue star-forming, red star-forming (green-shaded), and quiescent (red-shaded) regions. To highlight the key non-blue populations, galaxies are marked on all panels with a thick green square outline (red star-forming) or a thick red square outline (quiescent). Right: color–magnitude diagram with orange line and pink shaded area marking the predicted red sequence locus at zDET ± 0.25 mag. |
| In the text | |
|
Fig. 8. Mean fractions of galaxies located above RS −0.25 mag as a function of redshift. Left: The black line represents the total fraction, while the red (ETG) and blue (LTG) lines show their additive contributions to the total cluster population (f = Ntype/NTotal). Right: The lines show the type-wise quenching efficiency. In this panel, the ETG and LTG fractions are normalized by their own respective sub-population totals (f = Ntype/NTotal, type) to illustrate the intrinsic probability of each morphology being located above RS −0.25. |
| In the text | |
|
Fig. 9. Evolution of LTG (top row) and ETG (bottom row) fractions within the quiescent (Q), main-sequence+starburst (MS+SB) regimes (from left to right). Marker size encodes stellar-mass bins: [log(M★/M⊙) < 9.5], [9.5 ≤ log(M★/M⊙)≤10.5], and [log(M★/M⊙) > 10.5], and dashed error bars represent binomial uncertainties. We apply a stellar-mass threshold of log(Mcut(z)) to define the final sample, ranges from 6.5 at z = 0 to 8.9 at z = 4.0. |
| In the text | |
|
Fig. B.1. Average overdensity versus redshift for ETGs (red circles) and LTGs (blue squares), measured within cumulative apertures of 400 and 600 kpc. The MCMC fits and their 68% credible intervals are shown as dashed curves and shaded regions. These panels extend the results shown in Figure 4 for the 200 kpc aperture. |
| In the text | |
|
Fig. C.1. F277W completeness diagnostics showing galaxy counts as a function of total magnitude. Light-green and gray histograms trace the observed number counts, the dashed red line highlights the linear fit to the bright end, and vertical dashed markers mark the 100% (green), 70% (maroon), and 50% (red) completeness limits adopted in this work. |
| In the text | |
|
Fig. D.1. Stellar mass as a function of redshift for all catalog galaxies (gray) and confirmed group members (green). The dashed blue curve marks the stellar-mass completeness limit adopted in this analysis. |
| In the text | |
|
Fig. E.1. Annuli and radial surface-density diagnostics for group and field galaxy candidates; subsequent panels repeat the layout for additional groups. |
| In the text | |
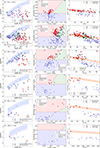 |
Fig. G.1. As Fig. 7 but for additional galaxy groups. |
| In the text | |
Current usage metrics show cumulative count of Article Views (full-text article views including HTML views, PDF and ePub downloads, according to the available data) and Abstracts Views on Vision4Press platform.
Data correspond to usage on the plateform after 2015. The current usage metrics is available 48-96 hours after online publication and is updated daily on week days.
Initial download of the metrics may take a while.