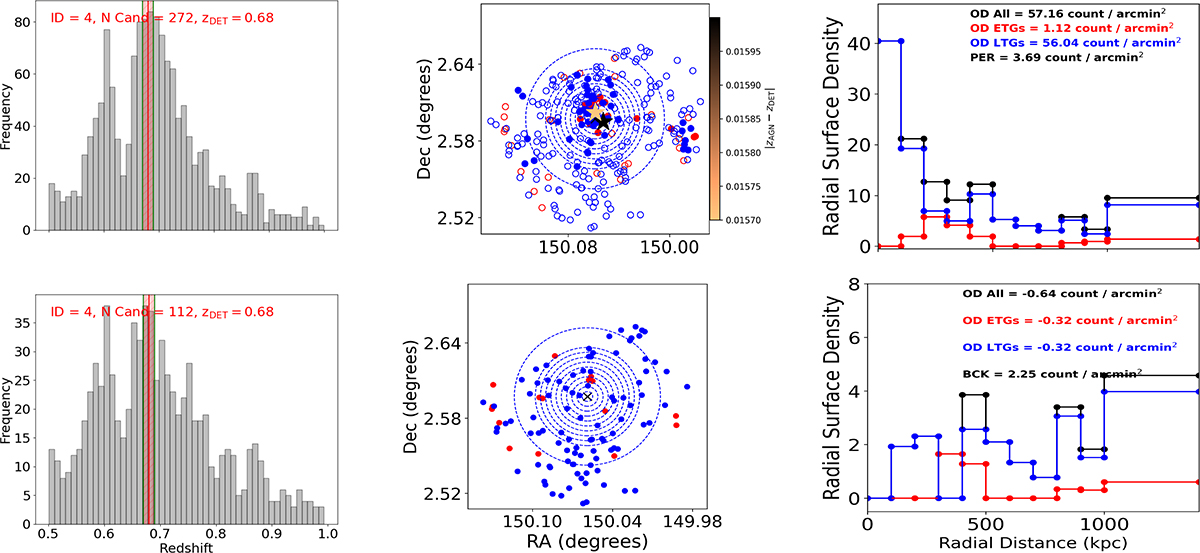
Fig. 2.
Download original image
Member-selection diagnostics for group ID 4. Left: redshift distribution of AMICO candidates. The red solid line and hatched region (bounded by green lines) represent zDET and the adopted selection window Δz = ±0.01(1 + zDET), respectively. Middle: projected distribution of LTGs (blue) and ETGs (red) in concentric annuli, with galaxies having assoc_prob > 0.5 shown as filled circles and those with assoc_prob ≤ 0.5 as unfilled circles; matched HLAGN are marked as stars colored by |zAGN − zDET|. Right: radial surface density profile showing ETG, LTG, and combined overdensities after subtracting the local background (PER). Panels in the bottom row repeat the analysis for high field-probability galaxies (e.g., FIELD_PROB > 0.7). Negative values indicate underdensities, where the accumulated density minus the outskirts baseline becomes negative.
Current usage metrics show cumulative count of Article Views (full-text article views including HTML views, PDF and ePub downloads, according to the available data) and Abstracts Views on Vision4Press platform.
Data correspond to usage on the plateform after 2015. The current usage metrics is available 48-96 hours after online publication and is updated daily on week days.
Initial download of the metrics may take a while.