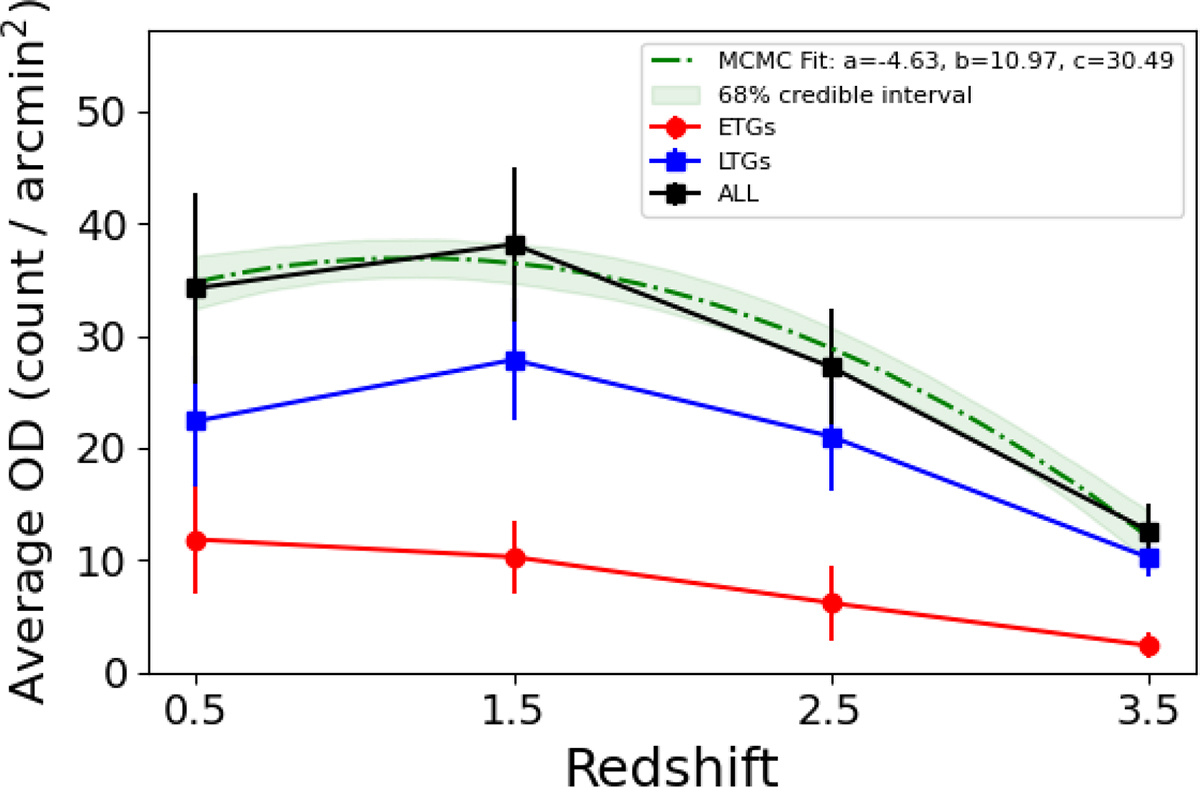
Fig. 4.
Download original image
Average overdensity versus redshift for ETGs (red circles) and LTGs (blue squares), and their sum (black), measured within cumulative apertures of 200 kpc. Error bars denote the standard error of the mean, while the dashed curve and shaded regions show the MCMC fit and its 68% credible interval for the combined population. Average overdensity of field galaxies is consistent with a constant background level.
Current usage metrics show cumulative count of Article Views (full-text article views including HTML views, PDF and ePub downloads, according to the available data) and Abstracts Views on Vision4Press platform.
Data correspond to usage on the plateform after 2015. The current usage metrics is available 48-96 hours after online publication and is updated daily on week days.
Initial download of the metrics may take a while.