Fig. 7.
Download original image
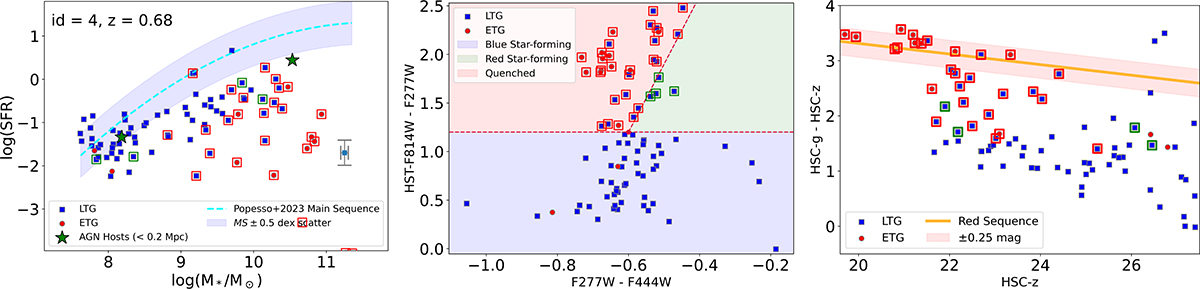
Diagnostic diagrams for group ID 4. Left: SFR versus stellar mass with LTGs (blue squares) and ETGs (red circles); the gray cross indicates typical uncertainties and the cyan dashed line shows the Popesso et al. (2023) main sequence. Middle: rest-frame color–color diagram. Crimson dashed line segments define an empirical, trapezoidal boundary separating the galaxy population into blue star-forming, red star-forming (green-shaded), and quiescent (red-shaded) regions. To highlight the key non-blue populations, galaxies are marked on all panels with a thick green square outline (red star-forming) or a thick red square outline (quiescent). Right: color–magnitude diagram with orange line and pink shaded area marking the predicted red sequence locus at zDET ± 0.25 mag.
Current usage metrics show cumulative count of Article Views (full-text article views including HTML views, PDF and ePub downloads, according to the available data) and Abstracts Views on Vision4Press platform.
Data correspond to usage on the plateform after 2015. The current usage metrics is available 48-96 hours after online publication and is updated daily on week days.
Initial download of the metrics may take a while.