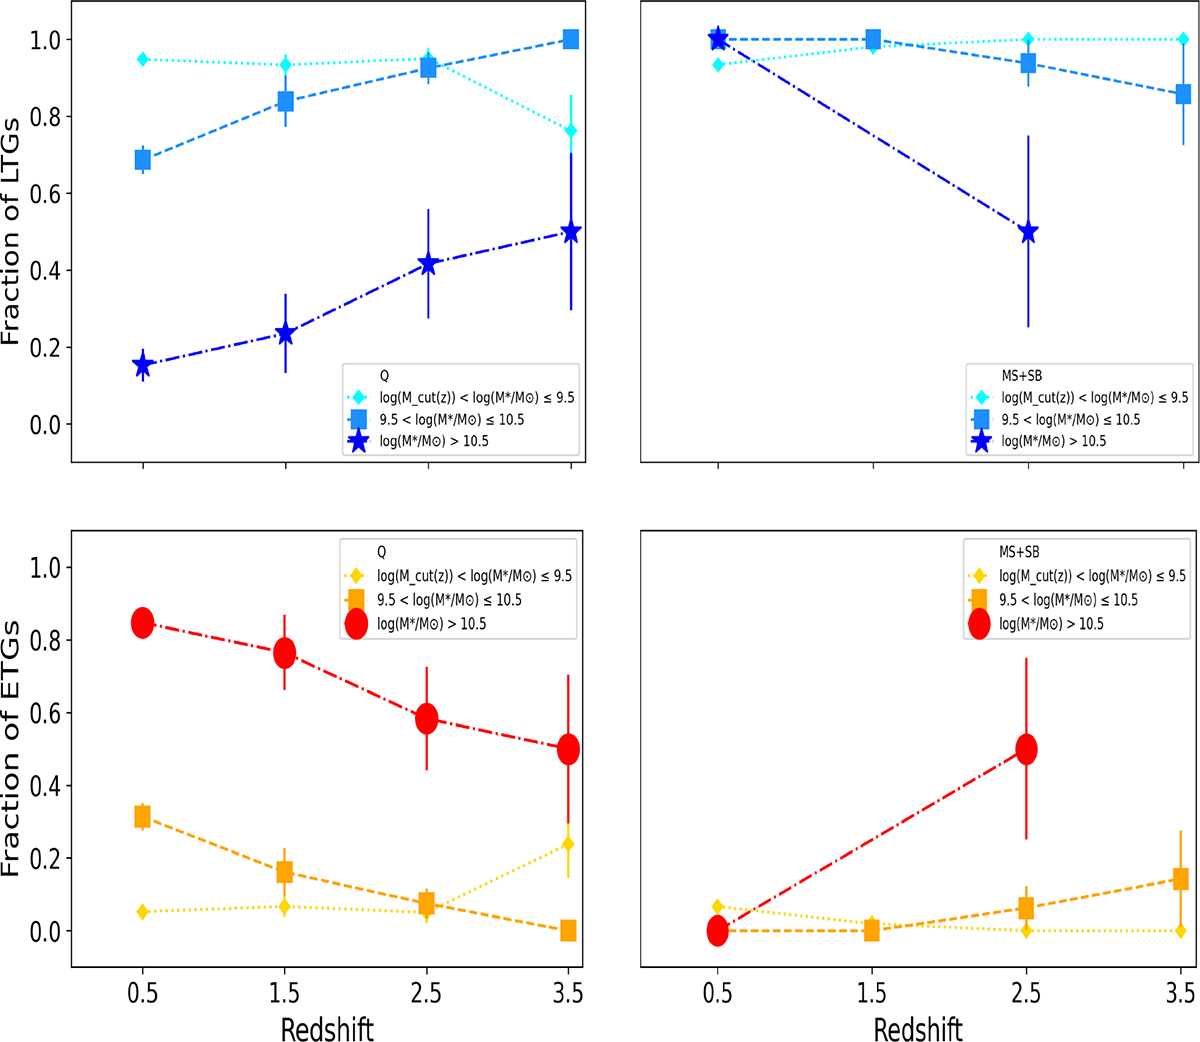
Fig. 9.
Download original image
Evolution of LTG (top row) and ETG (bottom row) fractions within the quiescent (Q), main-sequence+starburst (MS+SB) regimes (from left to right). Marker size encodes stellar-mass bins: [log(M★/M⊙) < 9.5], [9.5 ≤ log(M★/M⊙)≤10.5], and [log(M★/M⊙) > 10.5], and dashed error bars represent binomial uncertainties. We apply a stellar-mass threshold of log(Mcut(z)) to define the final sample, ranges from 6.5 at z = 0 to 8.9 at z = 4.0.
Current usage metrics show cumulative count of Article Views (full-text article views including HTML views, PDF and ePub downloads, according to the available data) and Abstracts Views on Vision4Press platform.
Data correspond to usage on the plateform after 2015. The current usage metrics is available 48-96 hours after online publication and is updated daily on week days.
Initial download of the metrics may take a while.